- The sterling is retracing down from 17-month highs.
- The level to beat for bears is the 1.3117 level.
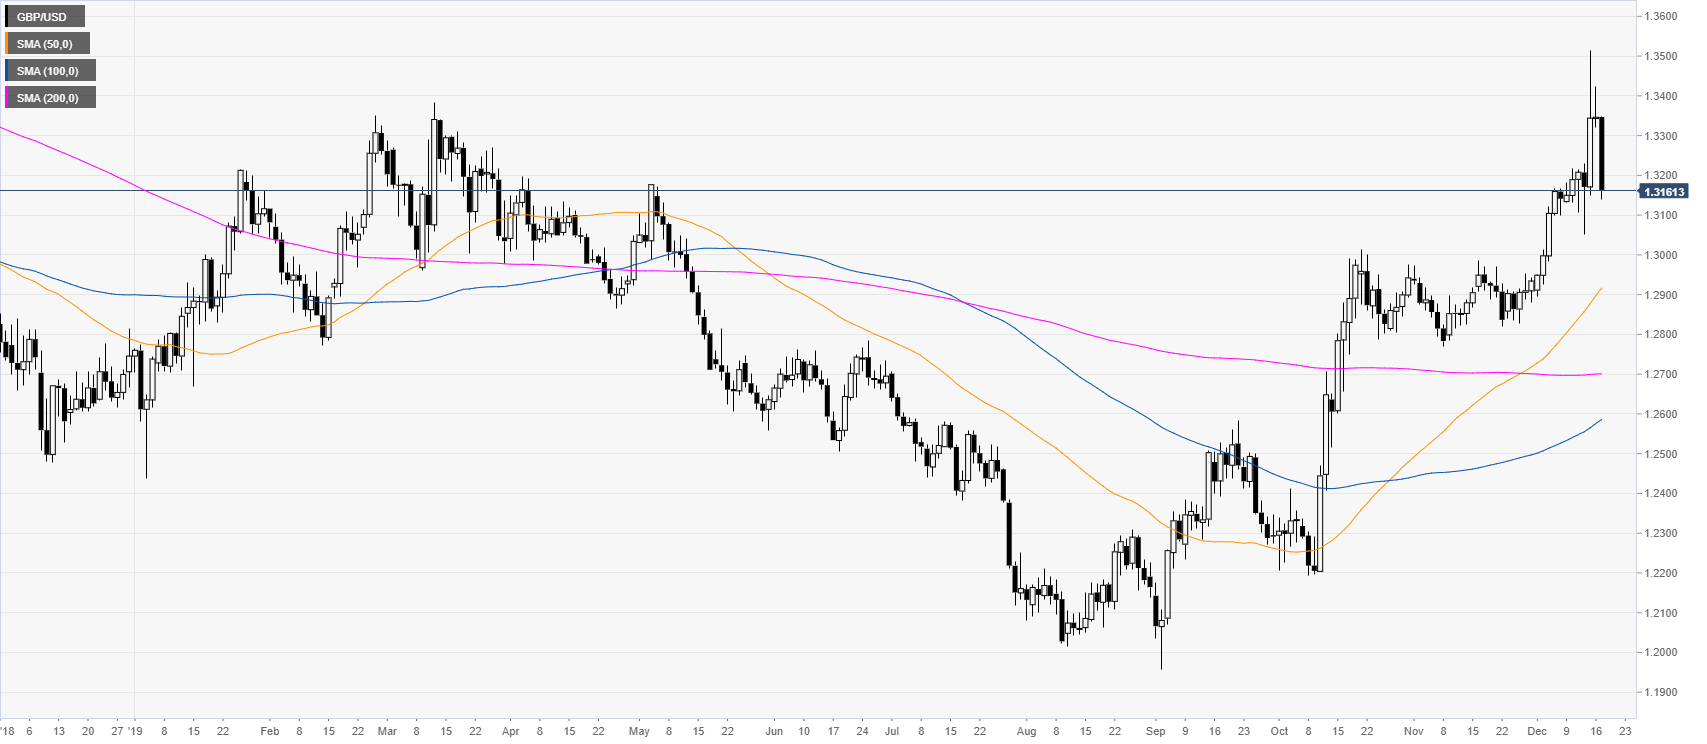
GBP/USD daily chart
The market is reversing down sharply from 17-month highs after the UK elections last week.
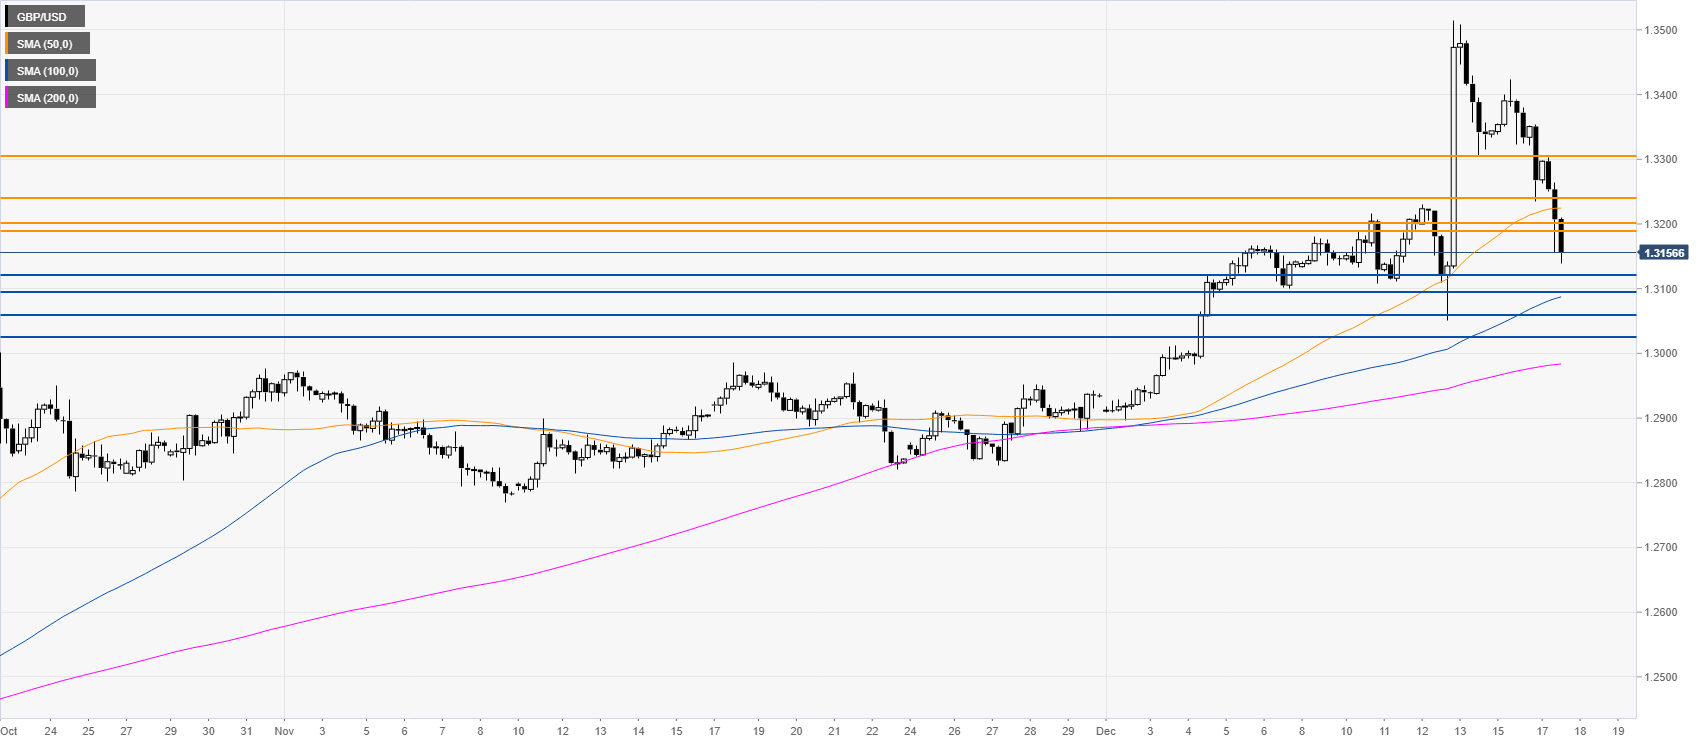
GBP/USD four-hour chart
GBP/USD is retracing down below the 1.3200 handle and the 50 SMA on the four-hour chart. Bears seem to have taken control. They will probably try to reach the 1.3117, 1.3095, 1.3055 and 1.3028 price levels, according to the Technical Confluences Indicator. Resistances are seen at the 1.3186, 1.3200, 1.3245 and 1.3300 levels.
Additional key levels
