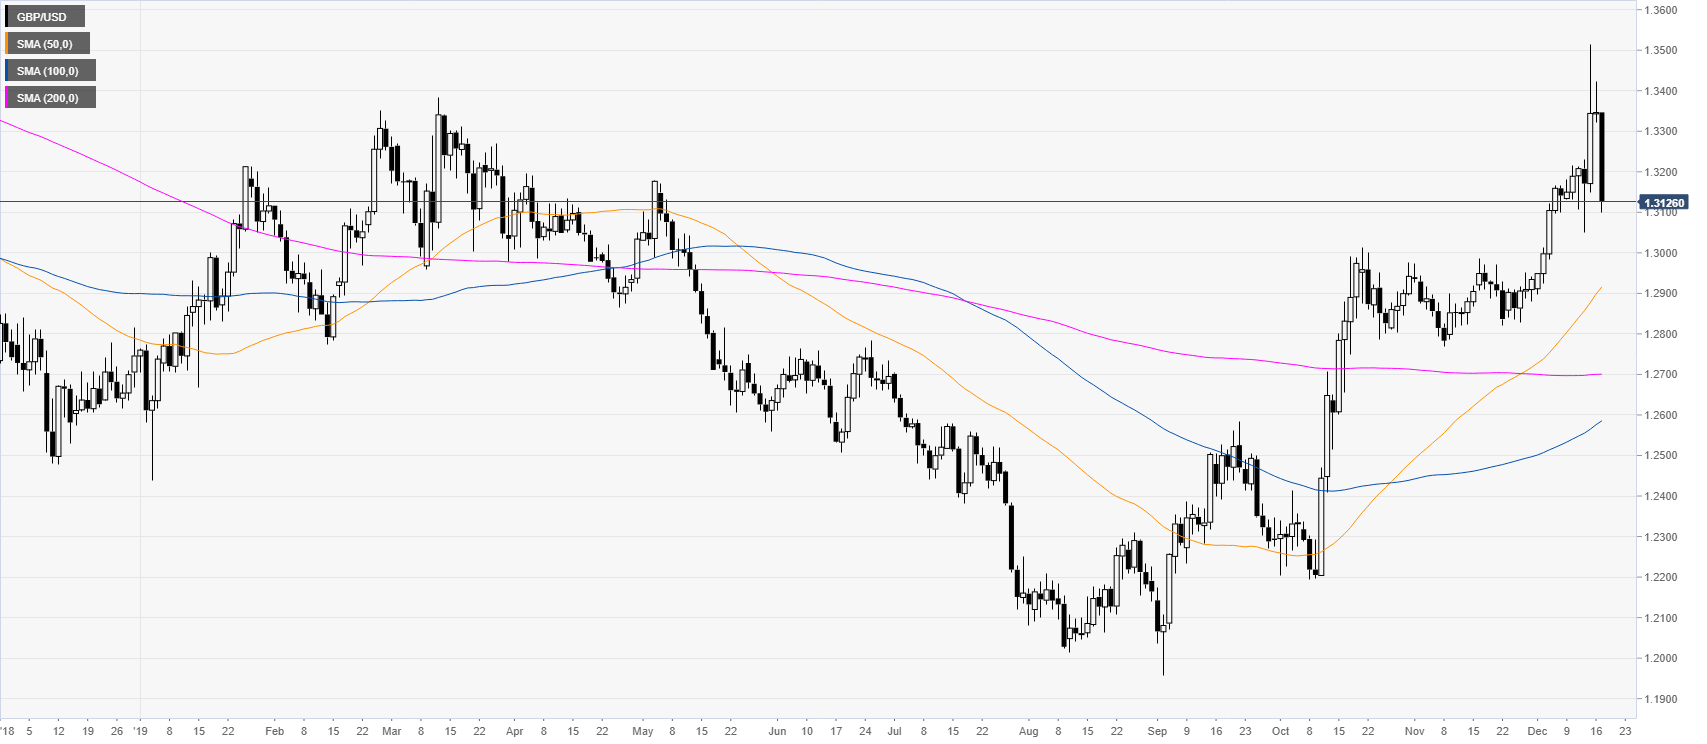
- The sterling is having its worst daily decline since November 2018.
- The level to beat for bears is the 1.3117/1.3095 support zone.
GBP/USD daily chart
The market is reversing down sharply from 17-month highs erasing the UK election spike. The sterling is on track to record its worst daily decline since November 2018.
GBP/USD four-hour chart
GBP/USD is challenging the 1.3117/1.3095 support zone below the 50 SMA on the four-hour chart. This was a critical zone before the breakout and the market could bounce from here. However, it remains to be seen how far can the bulls go considering the massive u-turn the cable has took. Resistances are seen at the 1.3186, 1.3200, 1.3245 and 1.3300 levels. If bears do break below the 1.3117/1.3095 support zone, the market should grind lower towards the 1.3055 and 1.3028 price levels, according to the Technical Confluences Indicator.
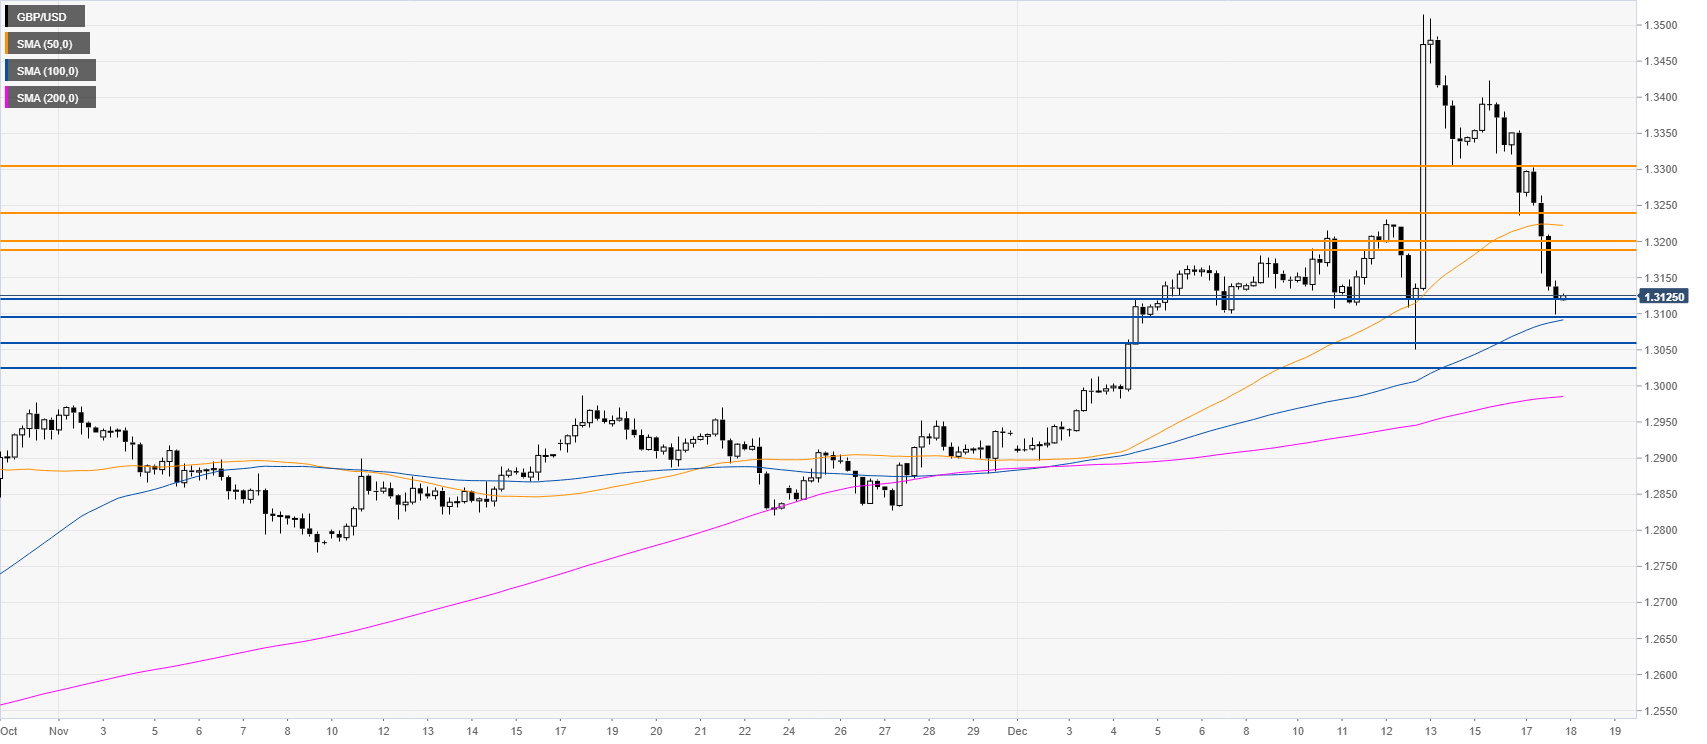
Additional key levels
