- EUR/USD registers another U-turn from the 1.1180/75 resistance area.
- A bearish candlestick formation keeps the sellers hopeful.
- August month high adds to the resistance.
EUR/USD marks another U-turn from the familiar 1.1180/75 resistance zone as it trades near 1.1150 during Wednesday’s Asian session.
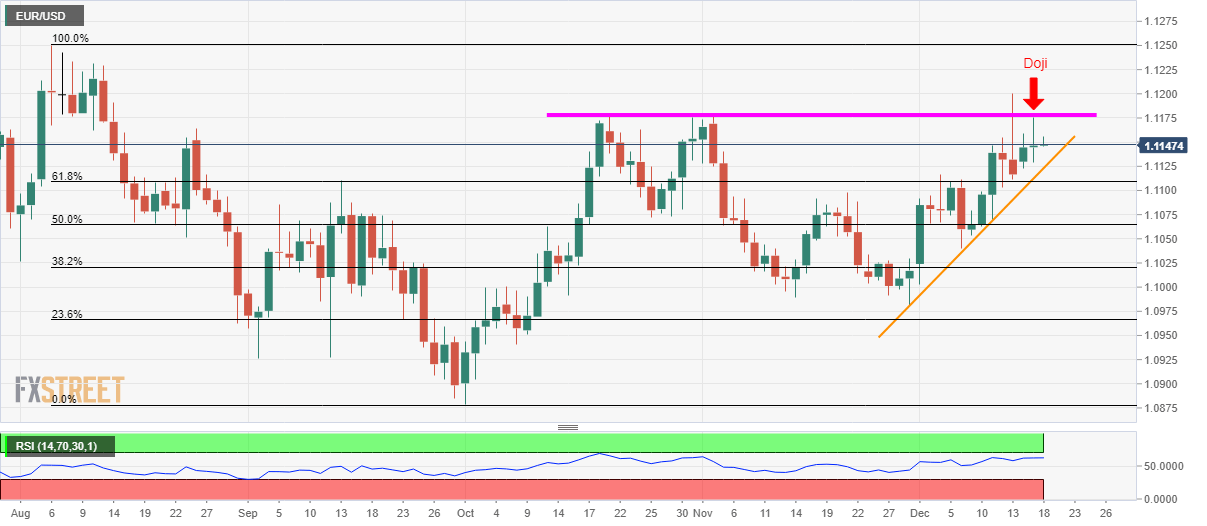
The quote flashed a bearish, ‘Doji’, candlestick formation on the daily (D1) chart on Tuesday, which in turn favors the pair’s declines. However, an upward sloping trend line since October 10, at 1.1123, can limit the immediate downside.
Should prices slip beneath 1.1123, 61.8% Fibonacci retracement of August-October declines, near 1.1110, followed by November 21 high near 1.1100, could keep sellers happy.
On the upside, a clear break of 1.1180 enables the bulls to challenge August month’s top close to 1.1250.
It’s worth mentioning that there are multiple upside barriers around 1.1230 during the pair’s rise between 1.1180 and 1.1250.
EUR/USD daily chart
Trend: Pullback expected
