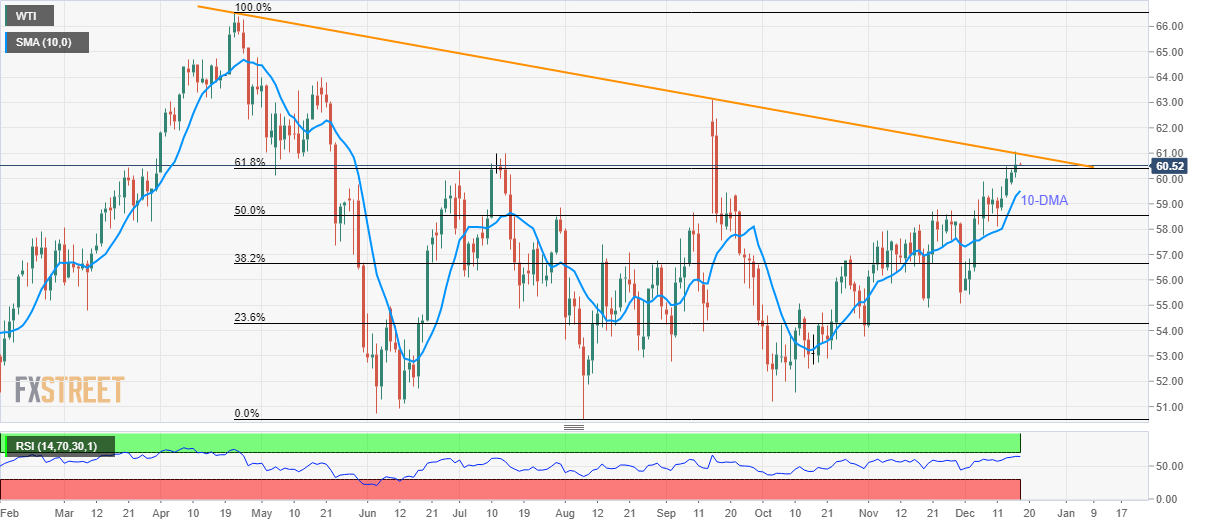
- WTI trades near a three-month high.
- 61.8% Fibonacci retracement of April-August declines acts as immediate support.
- An upside clearance will extend the rise towards the September month top.
WTI bulls seem to catch a breath around $60.50 during the initial trading session on Wednesday. The black gold surged to the fresh highs since September on Tuesday. However, a downward sloping trend line since April restricts immediate upside.
Looking at the nearly overbought conditions of the 14-day Relative Strength Index (RSI), prices are likely to register another U-turn from the key resistance line. In doing so, 61.8% Fibonacci retracement level of $60.40 can act as short-term support.
In a case that bears sneak in below $60.40, 10-Day Simple Moving Average (DMA) around $59.50 gains market attention.
Alternatively, the price run-up beyond the medium-term resistance line, at $61.00 now, can propel the energy benchmark’s rise towards September month top nearing $63.15.
Though, $62.30 can act as an intermediate rest during the quote’s rise beyond $61.00.
WTI daily chart
Trend: Pullback expected
