- DXY takes the bids after breaking the eight-day-old falling trend line.
- 200-bar EMA, late-November lows offer strong resistance.
- A yearly support line limits near-term declines.
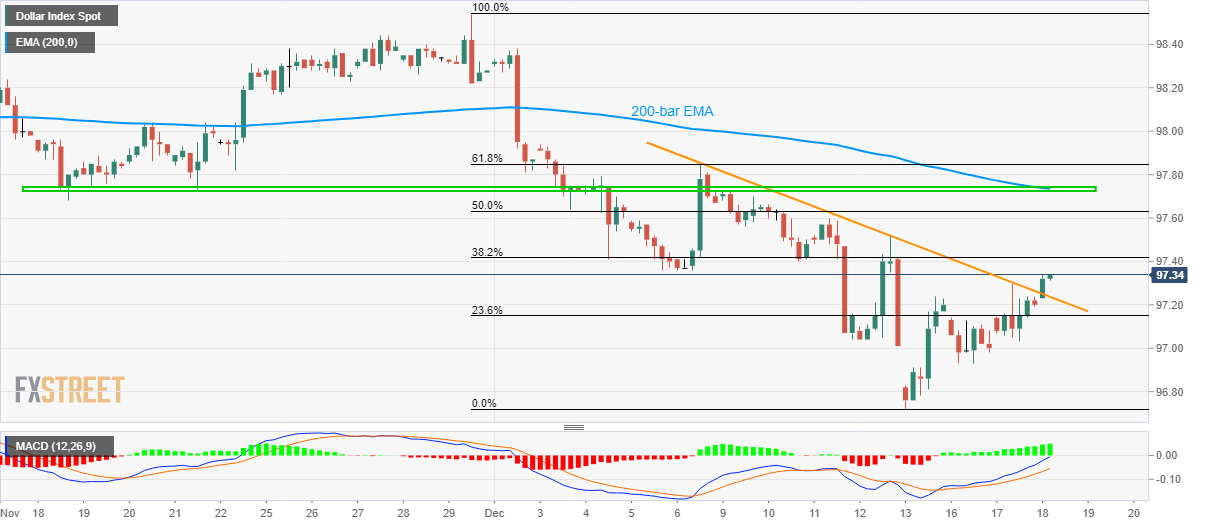
The US Dollar Index (DXY) takes the bids to 97.33 while heading into the European session on Wednesday. In doing so, the greenback gauge crosses a descending trend line stretched since December 06.
The quote now aims at 50% Fibonacci retracement of November 29 to December 13 fall, at 97.63. However, a confluence of 200-bar Exponential Moving Average (EMA) and multiple lows marked since November 18 can keep further upside limited around 97.70/75.
During the gauge’s rise beyond 97.75, 61.8% Fibonacci retracement level of 97.85 and 98.00 can entertain buyers ahead of pleasing them with the November month top close to 98.54.
On the flip side, a slip beneath the resistance-turned-support, at 97.25, can recall 97.00 on the chart.
Though, the Bears’ dominance below 97.00 could be challenged by the yearly trend line, at 96.73 now.
DXY four-hour chart
Trend: Bullish
