- USD/JPY is stuck near 109.50, which was a critical level in 2019.
- The level to beat for bulls is the 109.75 resistance.
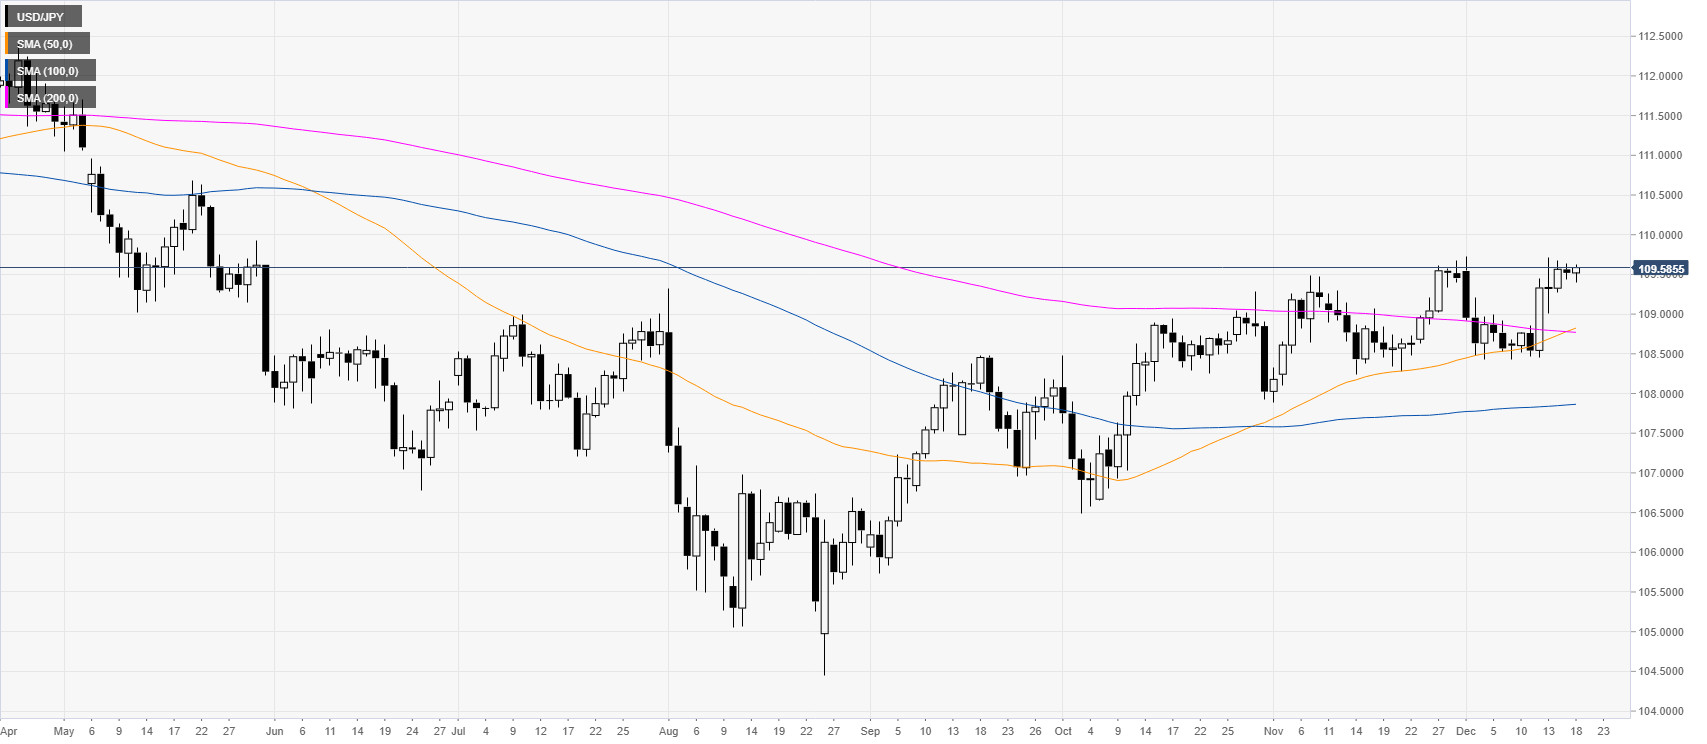
USD/JPY daily chart
USD/JPY is approaching the December highs just above the 109.50 level, which was a strong support and resistance level throughout 2019.
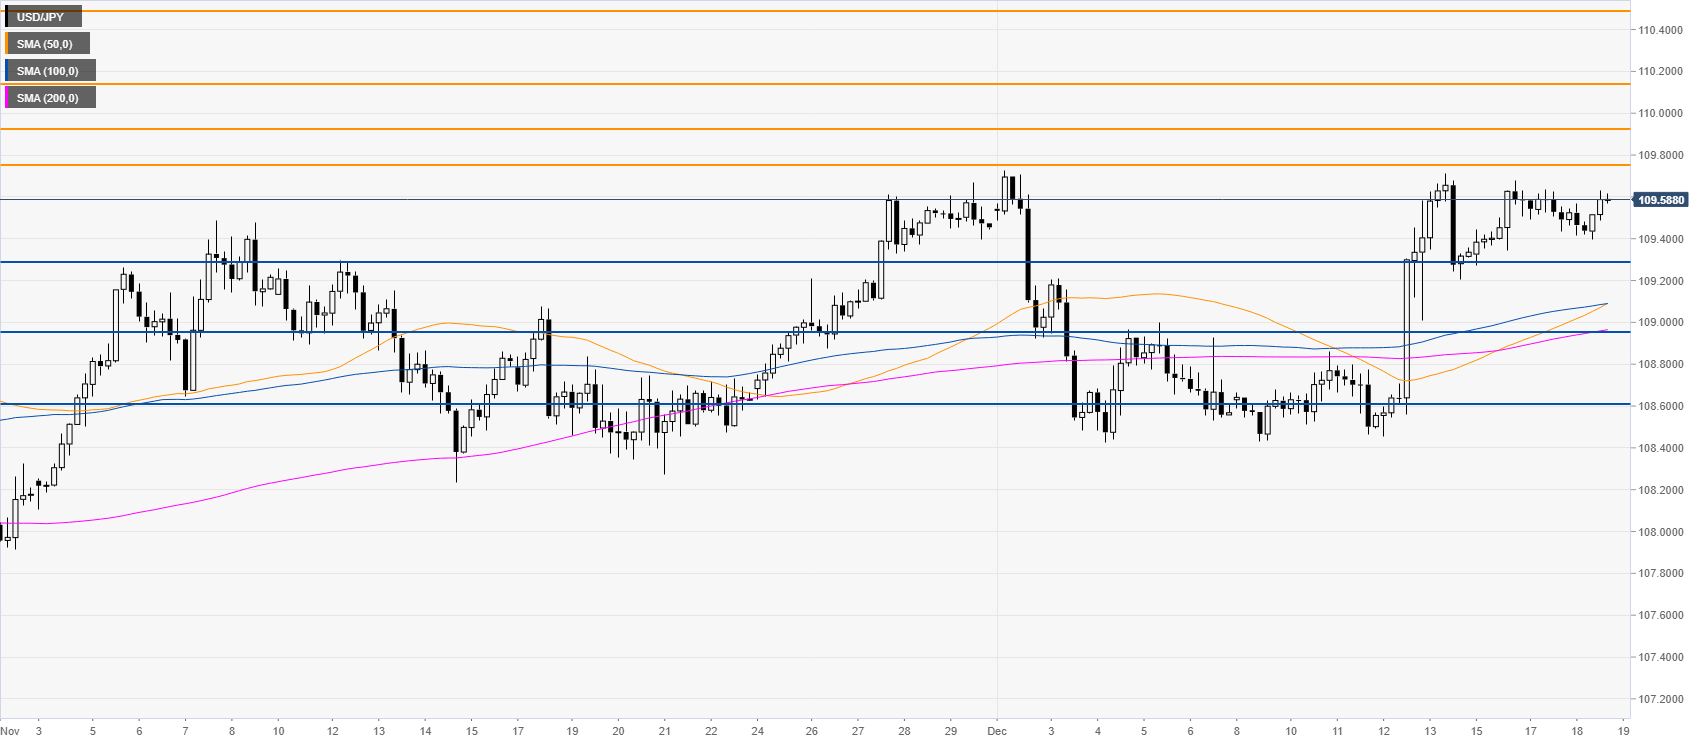
USD/JPY four-hour chart
The spot is consolidating below the 109.75 level as the buyers are looking for a clear breakout above the resistance to extend the bullish move towards the 109.92, 110.14 and 110.49 levels. However, the 109.75 level is a strong resistance and investors will probably need a catalyst. On the flip side, if the bears manage to drive the price down below the 109.30 level, the spot could decline towards the 108.95 and 108.61 price levels, according to the Technical Confluences Indicator.
Additional key levels
