- GBP/USD bears catch a breath around the 12-day low.
- 61.8% Fibonacci retracement restricts immediate upside.
- Mid-November highs hold the key to the multi-week-old horizontal support.
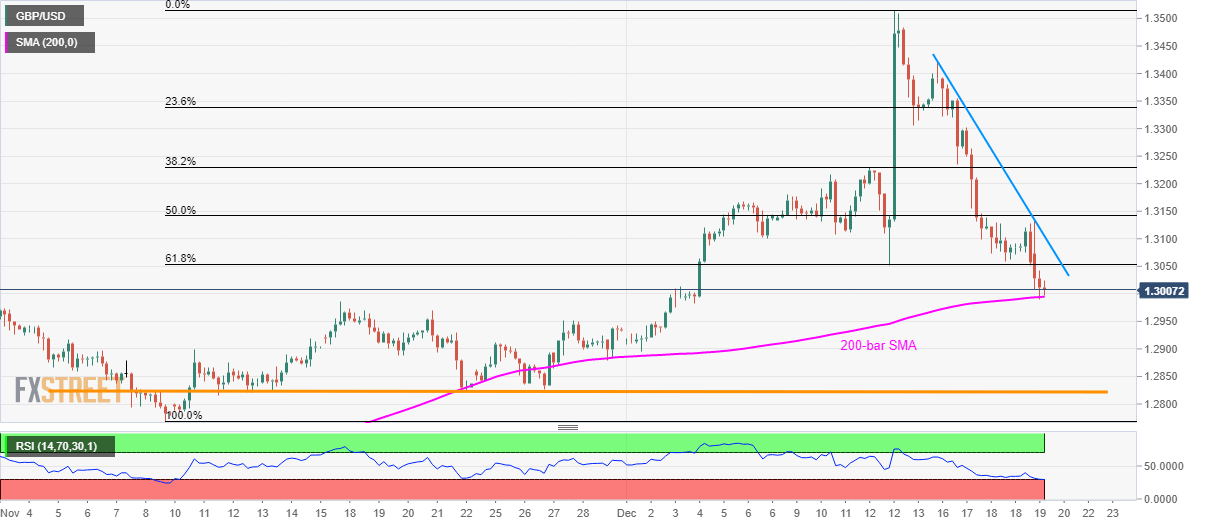
While trading around 1.3010, 200-bar Simple Moving Average (SMA) restricts GBP/USD pair’s further declines during early Friday in Asia. Along with that, oversold conditions of the 14-bar Relative Strength Index (RSI) also raise doubts on the pair’s further downside and increase odds of a U-turn.
In doing so, 61.8% Fibonacci retracement of November-December upside, at 1.3055, becomes immediate resistance to watch, a break of which could propel the quote towards weekly descending trend line, at 1.3105.
Should buyers manage to dominate past-1.3105, pair’s extended run-up towards 1.3230 seems to turn into reality.
Alternatively, a downside break of 200-bar SMA level of 1.2995 can take rest on multiple support around 1.2980 and 1.2955/50 marked during mid-November.
Though, six-week-old horizontal support near 1.2820 will question bears below 1.2950 while holding the gates to November month low near 1.2770.
GBP/USD four-hour chart
Trend: Recovery expected
