- USD/CAD registers a three-day winning streak after it crossed the monthly trend line on Friday.
- Bearish MACD doubts pair’s recent recovery, 50-DMA acts as an immediate upside barrier.
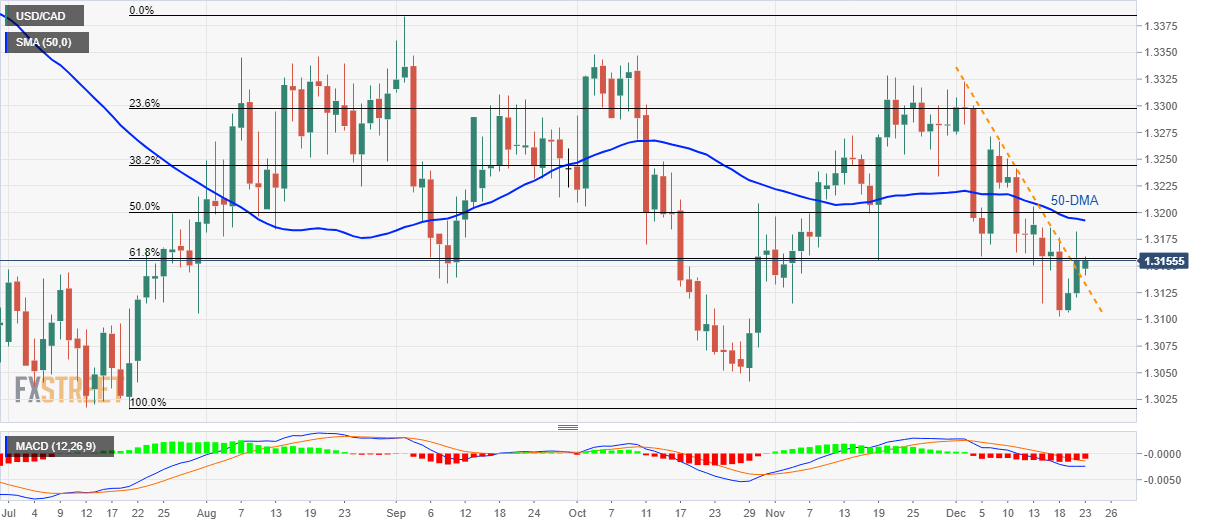
USD/CAD takes the bids to 1.3155 during Monday’s Asian session. The pair stays positive for the third consecutive day after it broke a month-old downward sloping trend line on Friday. However, 61.8% Fibonacci retracement of July-September upside limits the pair’s recovery.
Buyers look for entry beyond the 61.8% Fibonacci retracement level of 1.3160 while targeting the 50-Day Simple Moving Average (DMA) level of 1.3193.
Though, 1.3200 round-figure, 23.6% Fibonacci retracement, near 1.3300 and monthly top close to 1.3323 will act as consecutive challenges for the bulls past-1.3193.
On the downside, pair’s declines below the resistance-turned-support line, at 1.3133 now, can recall the recent low surrounding 1.3100.
If at all buyers fail to enter around 1.3100, 1.3040 and 1.3015 could offer few more chances for the pair’s reversal ahead of dragging it to sub-1.3000 area.
USD/CAD daily chart
Trend: Pullback expected
