- GBP/USD takes the bids to three-day high, near 23.6% Fibonacci retracement.
- A confluence of 50-day SMA, 38.2% Fibonacci retracement questions the pair’s declines past triangle breakdown.
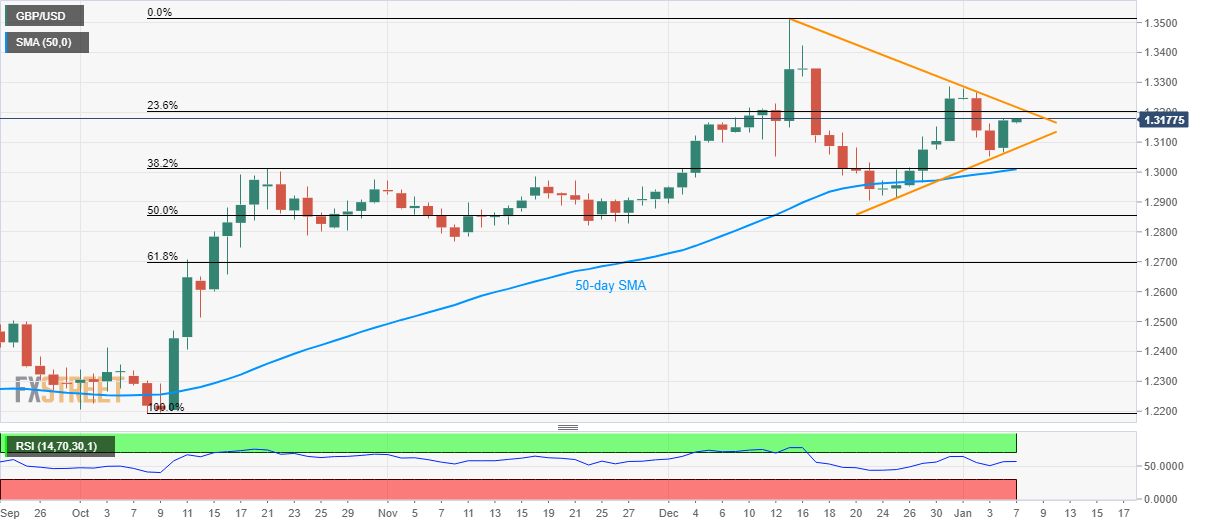
GBP/USD trades near 1.3180 amid the initial Asian session on Tuesday. The pair registered noticeable gains on the previous day, which in turn helps the quote to form a short-term symmetrical triangle pattern on the daily chart.
Prices are currently heading towards 23.6% Fibonacci retracement level of October-December upside, at 1.3200, a break of which could escalate the recovery to triangle’s resistance line, at 1.3220 now.
While a pullback from 1.3220 is most likely, an upside break of the same can challenge the monthly top near 1.3280.
Meanwhile, the pattern’s support at 1.3080 acts as an immediate rest-point to watch during the pair’s U-turn.
Also worth mentioning is the confluence of 50-day SMA and 38.2% Fibonacci retracement, around 1.3010, if sellers manage to smash the chart formation.
GBP/USD daily chart
Trend: Bullish
