- USD/JPY is trying to reverse the losses made at the very start of the month.
- The level to beat for buyers is the 108.45/50 price zone.
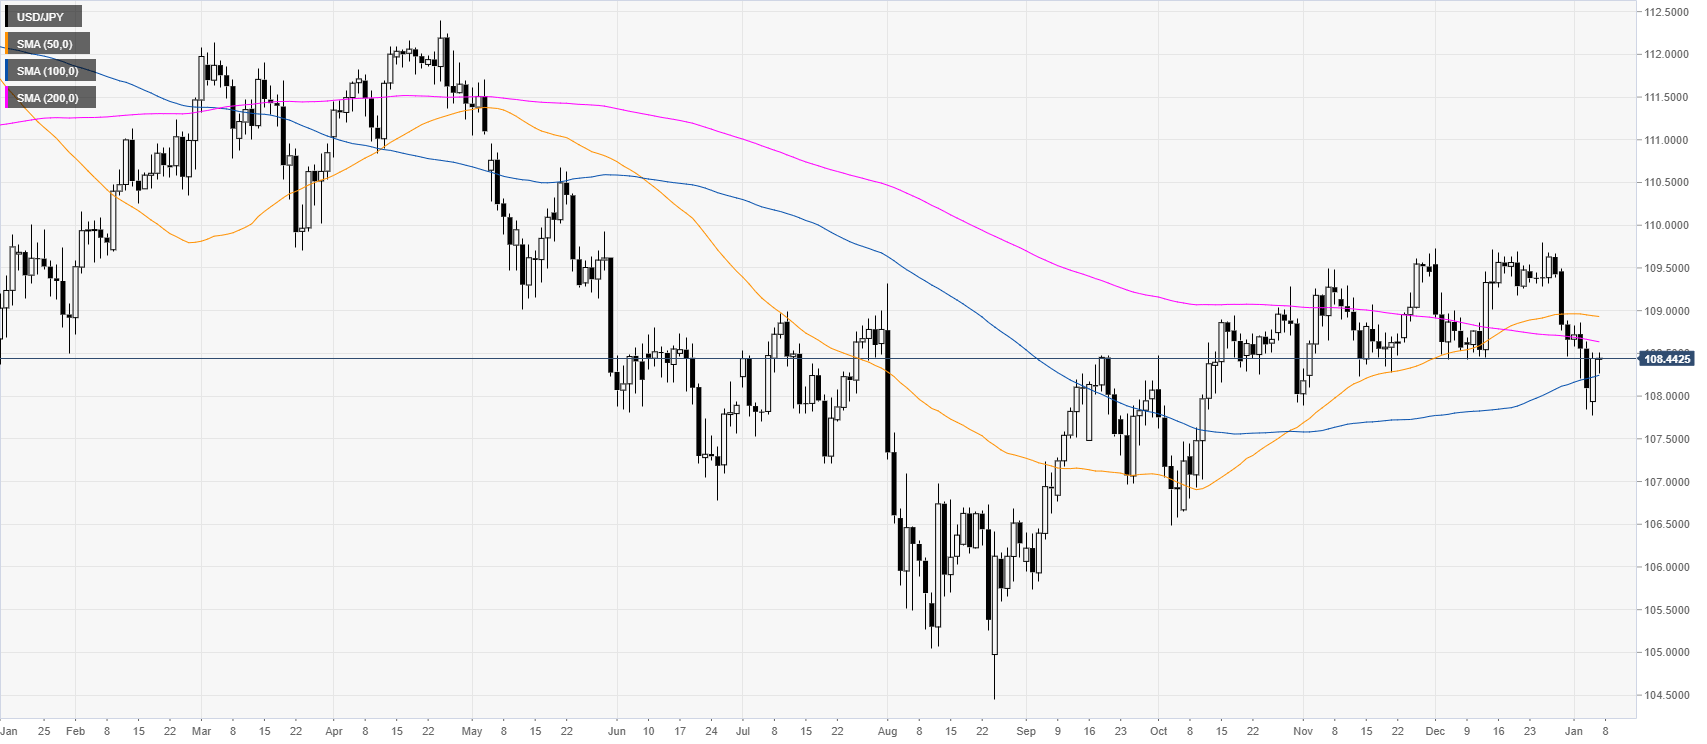
USD/JPY daily chart
USD/JPY is bouncing from the 108.00 handle and the 100-day simple moving average (SMA). The market is trading below the 50 and 200-day simple moving averages (SMAs) while breaking from a bearish wedge formation.
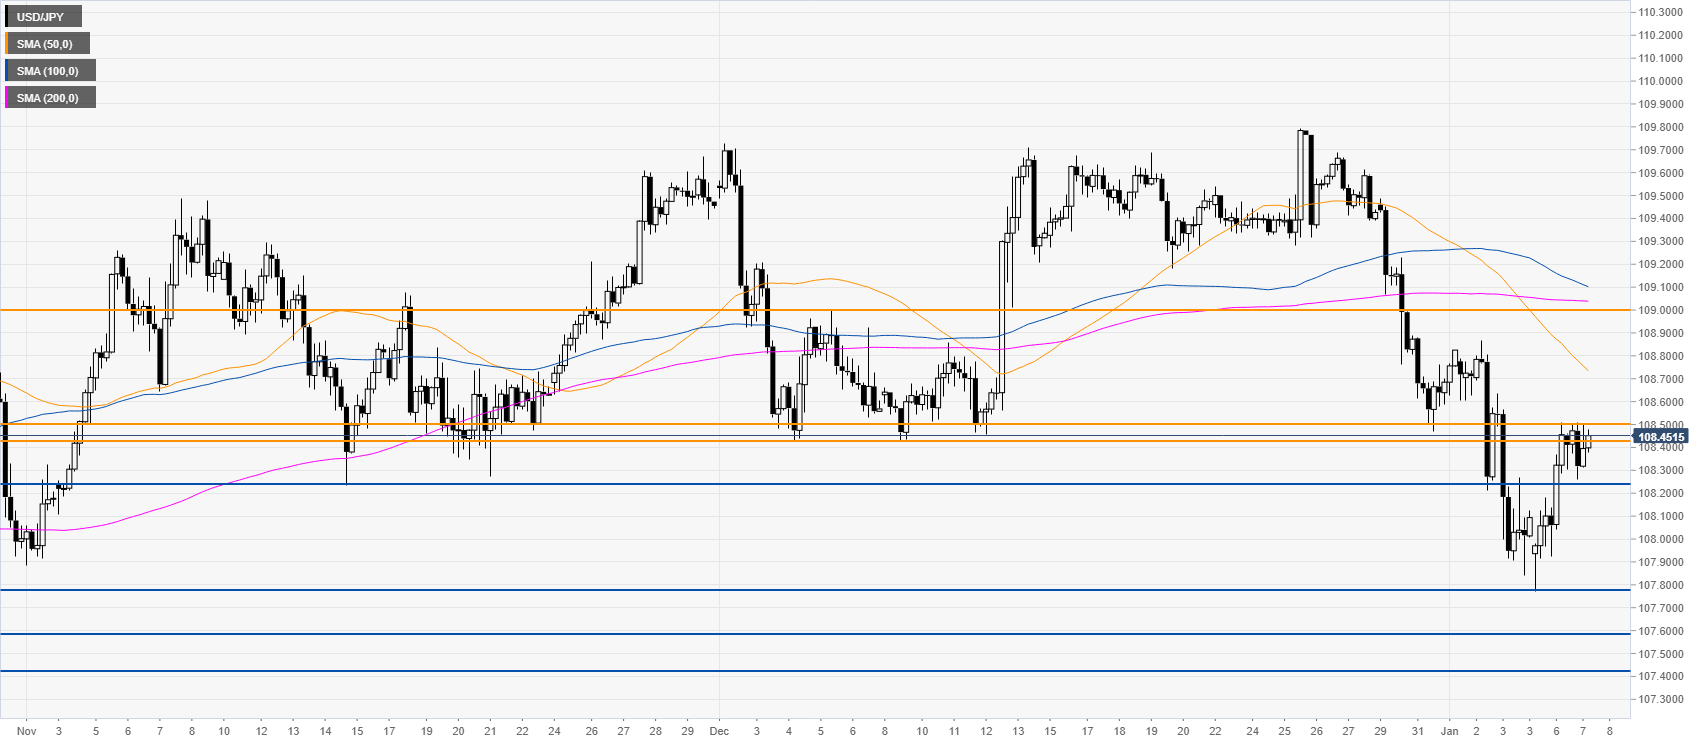
USD/JPY four-hour chart
The market is reversing up while testing the 108.45/50 resistance zone. A breakout beyond this level can open the gates to a bullish extension to the 109.00 handle. On the flip side, if sellers take over and break the 108.23 support, the spot can lose strength and decline towards the 107.78, 107.60 and 107.44 price levels, according to the Technical Confluences Indicator.
Additional key levels
