- USD/INR buyers are eying the November highs.
- The level to beat for bulls is the 72.65 resistance.
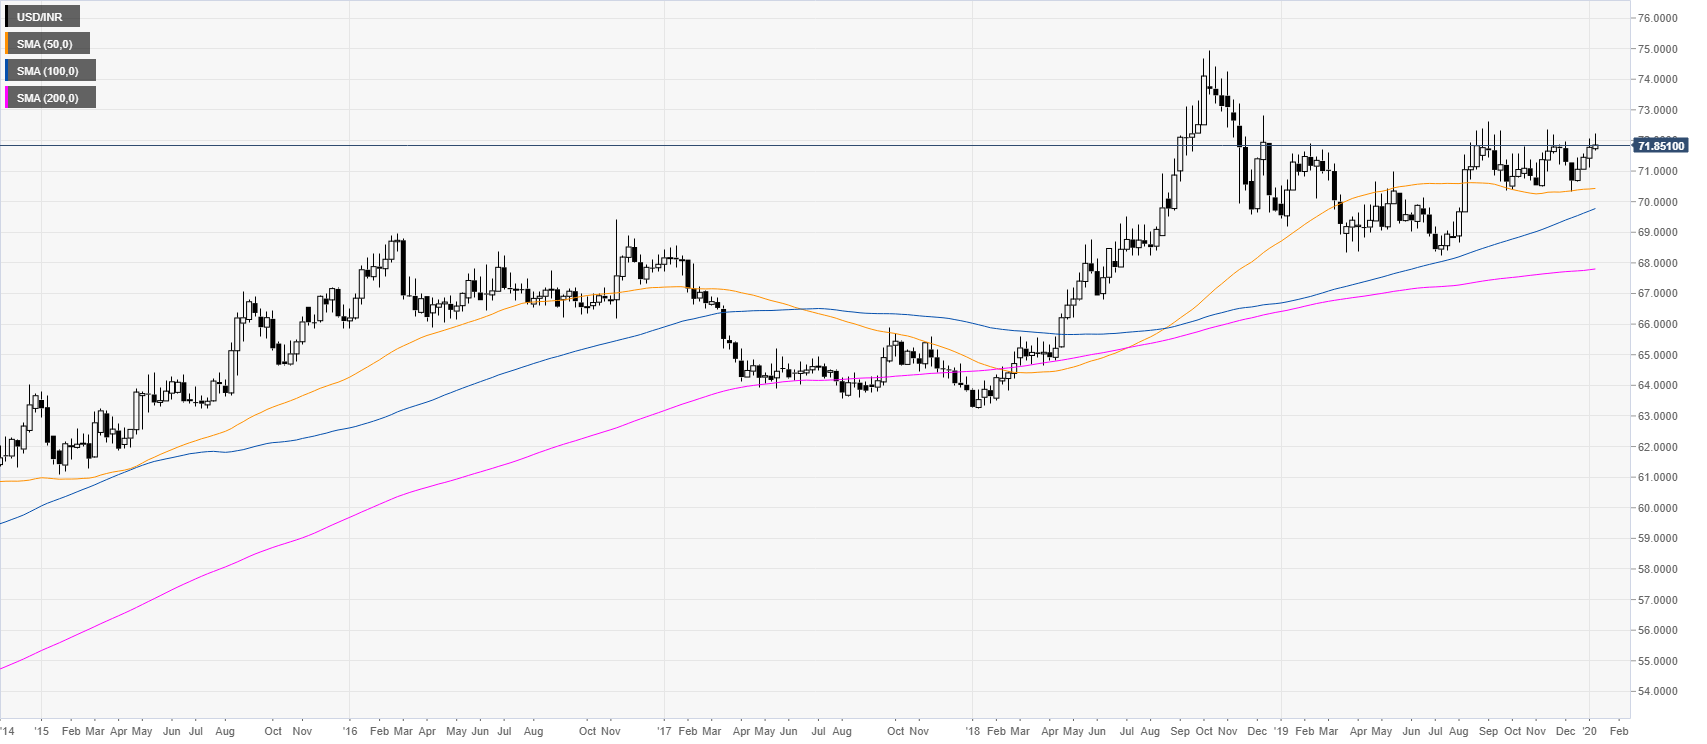
USD/INR weekly chart
USD/INR, in the second half of 2019, consolidated in a bull flag the 2018 bull run while above the main weekly simple moving averages (SMAs).
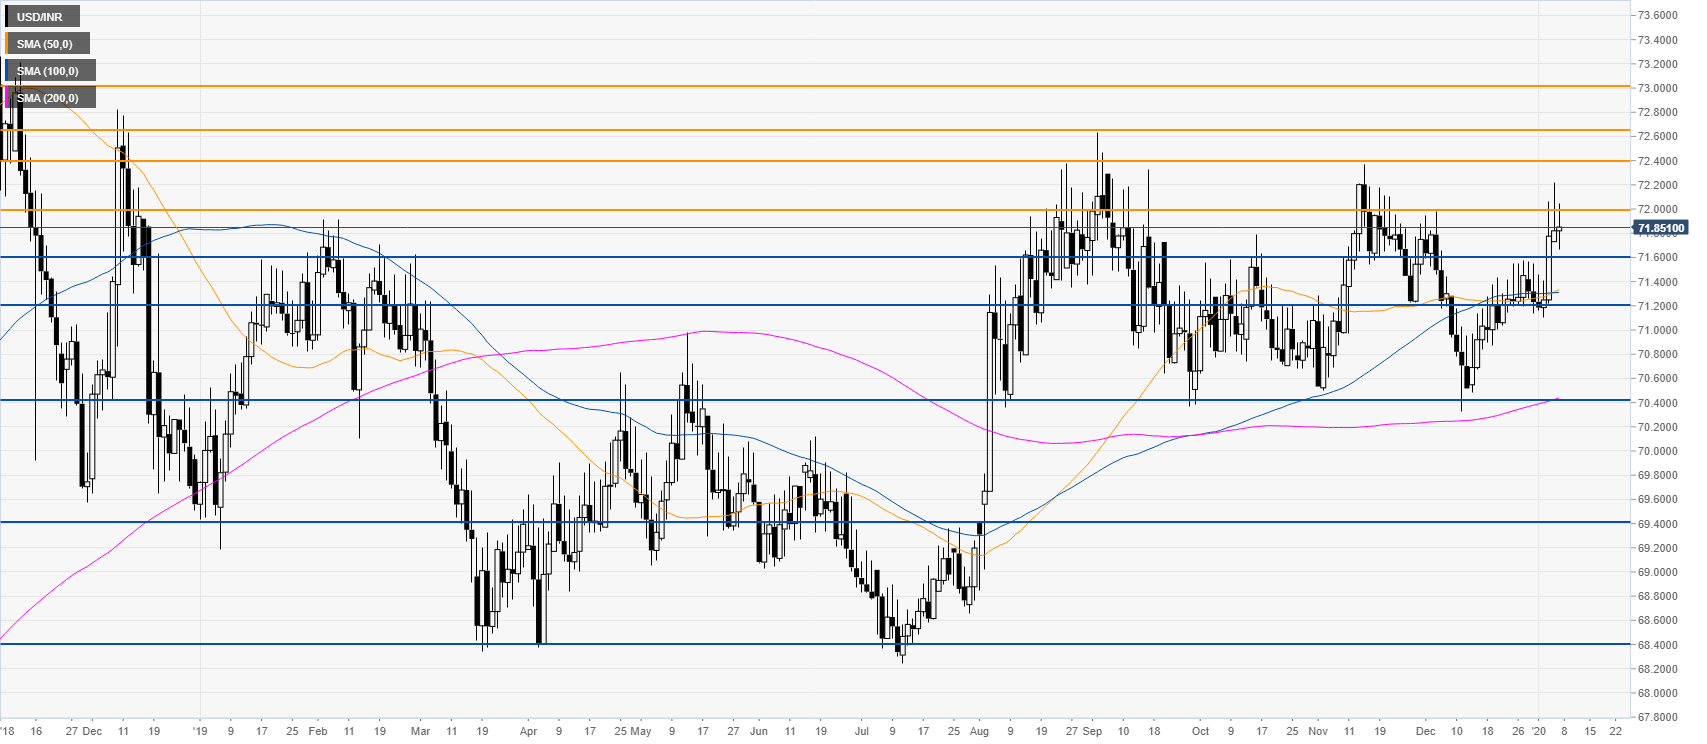
USD/INR daily chart
The market is trapped in a rectangle pattern in the 70.40-72.40 range while holding above the main daily simple moving averages (SMAs). Buyers want a daily close above 72.65 to climb towards the 73.00 handle and beyond. However, if sellers reject those levels, the market is set to remain in the range with a potential drop to 71.60, 71.20 and 70.40 levels.
Additional key levels
