- The 2019 uptrend is entering 2020 with a bullish breakout.
- The level to beat for bulls is the 1560/1600 price zone.
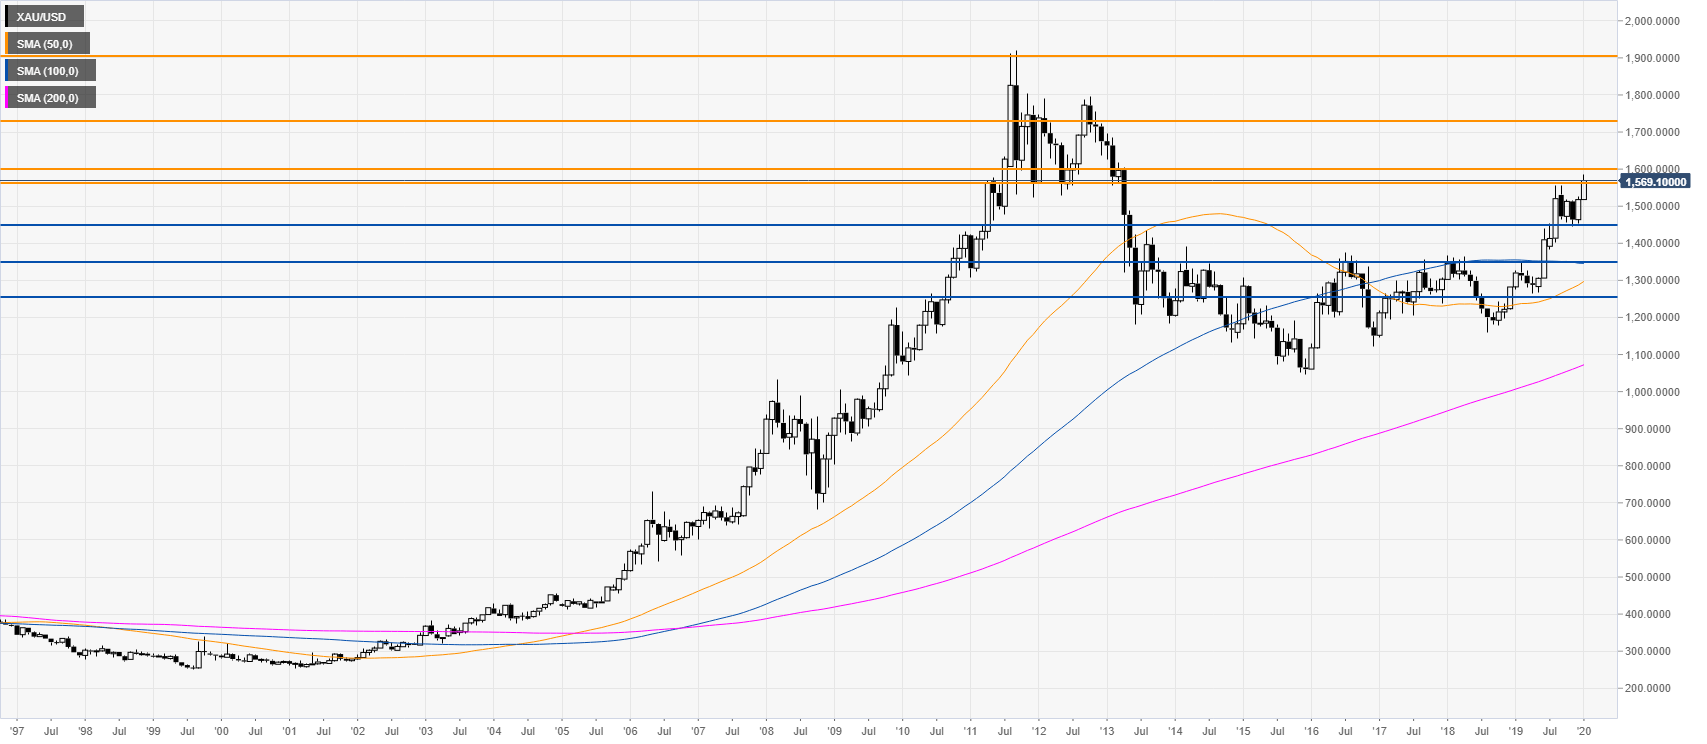
Gold monthly chart
The yellow metal is trading in a bull trend above its main monthly simple moving averages (SMAs). The market is attempting to have a convincing break above the 1560/1600 price zone. If the buyers overcome this crucial resistance zone, the market could climb to the 1730 and 1900 resistance levels.
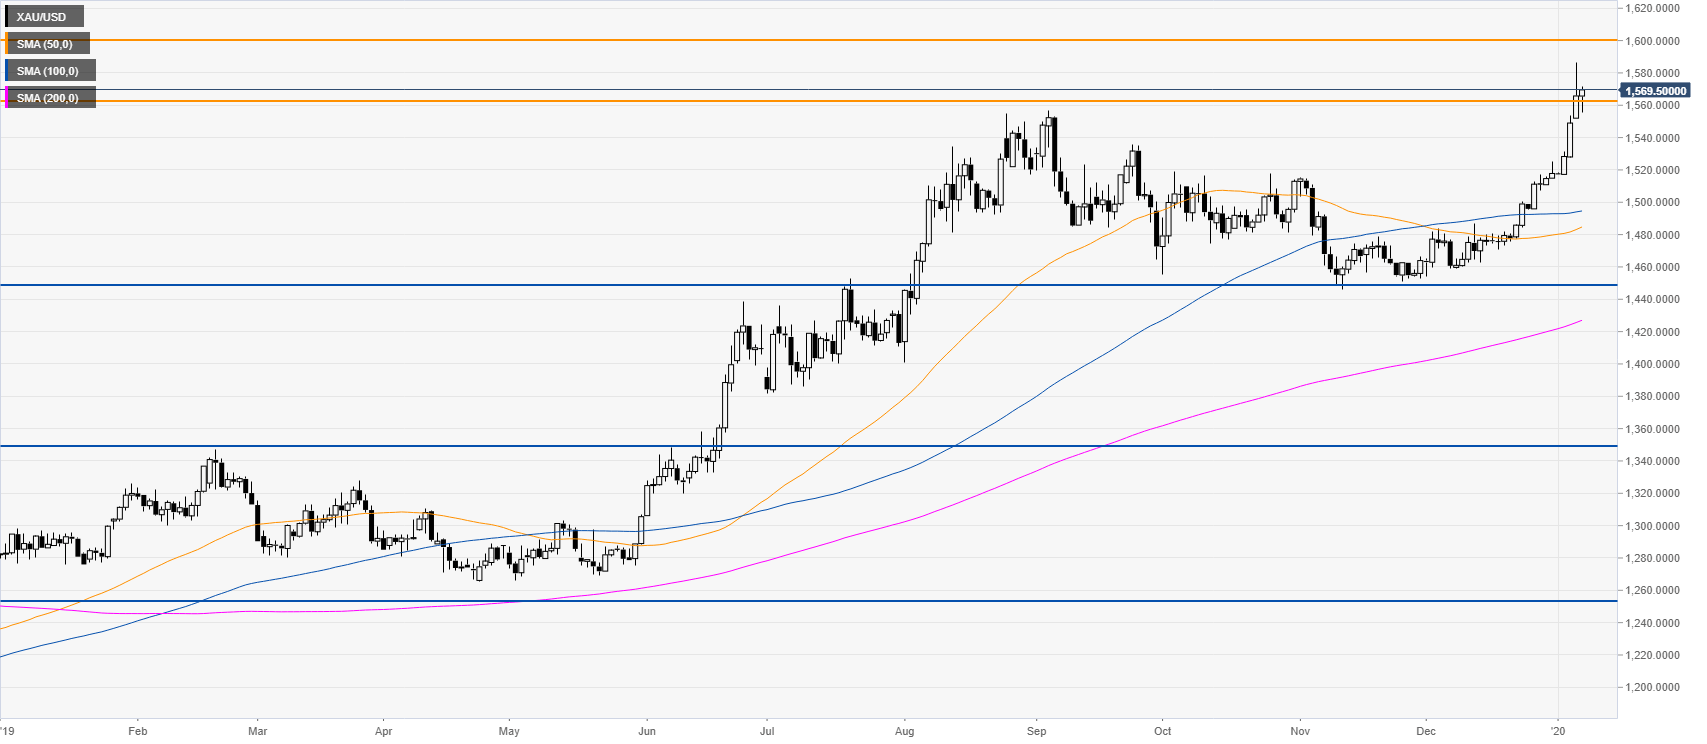
Gold daily chart
The market is clinging to gains near 6.5-year highs. However, if the bulls fail to surpass the 1560/1600 resistance zone and it gets faded, the metal could drop back to 1445 support. After a wich, a correction down to the 1350 and 1250 levels could potentially be on the cards.
Additional key levels
