- USD/JPY is attempting to reverse the decline started at the start of the month.
- The level to beat for bulls is the 108.45/50 price zone.
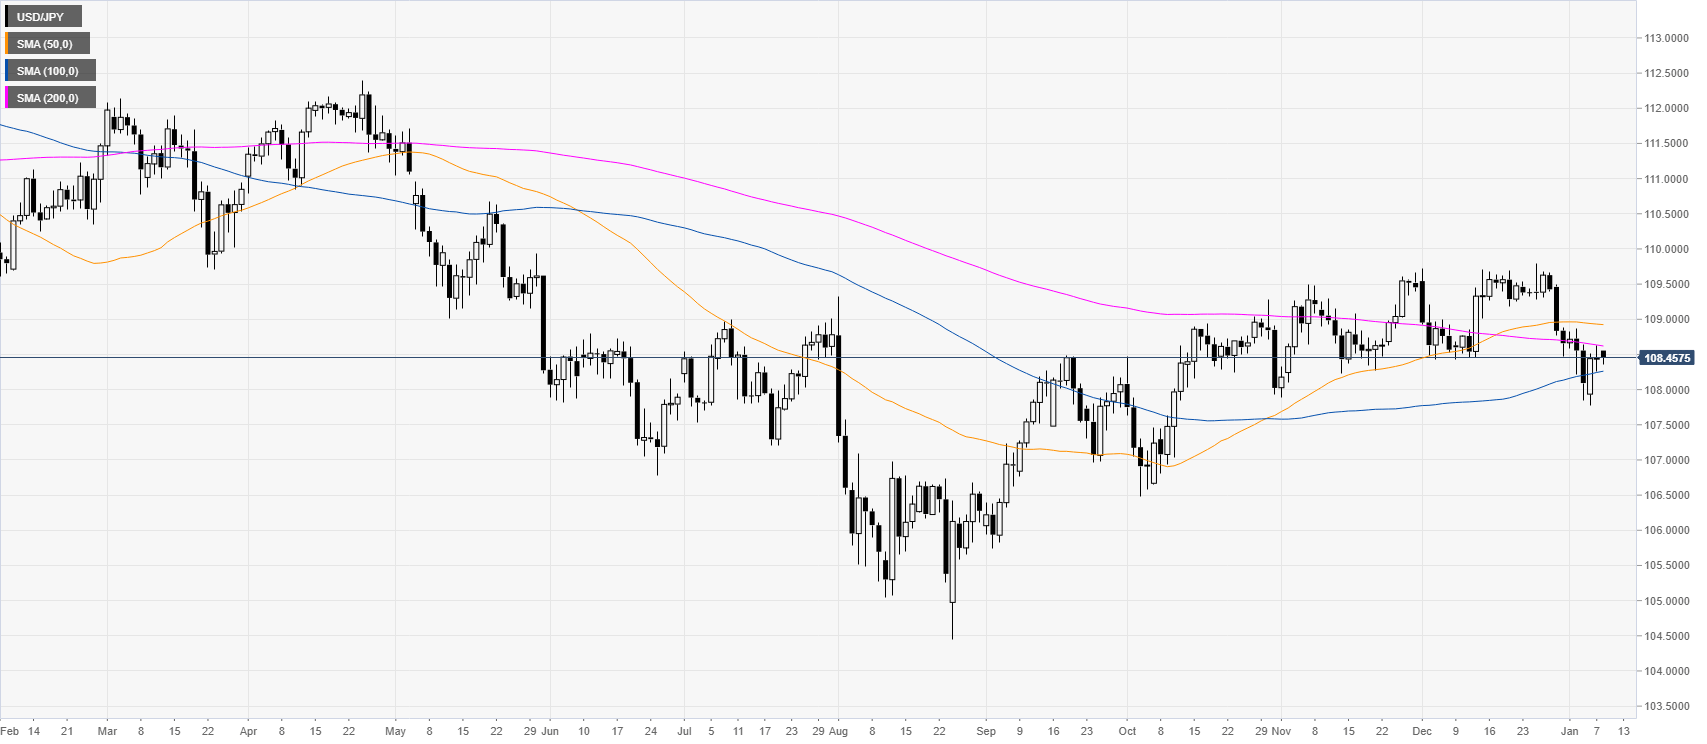
USD/JPY daily chart
USD/JPY is reversing up from the 108.00 handle and the 100-day simple moving average (SMA). The market is trading below the 50 and 200-day simple moving averages (SMAs) while breaking down from a bearish wedge pattern.
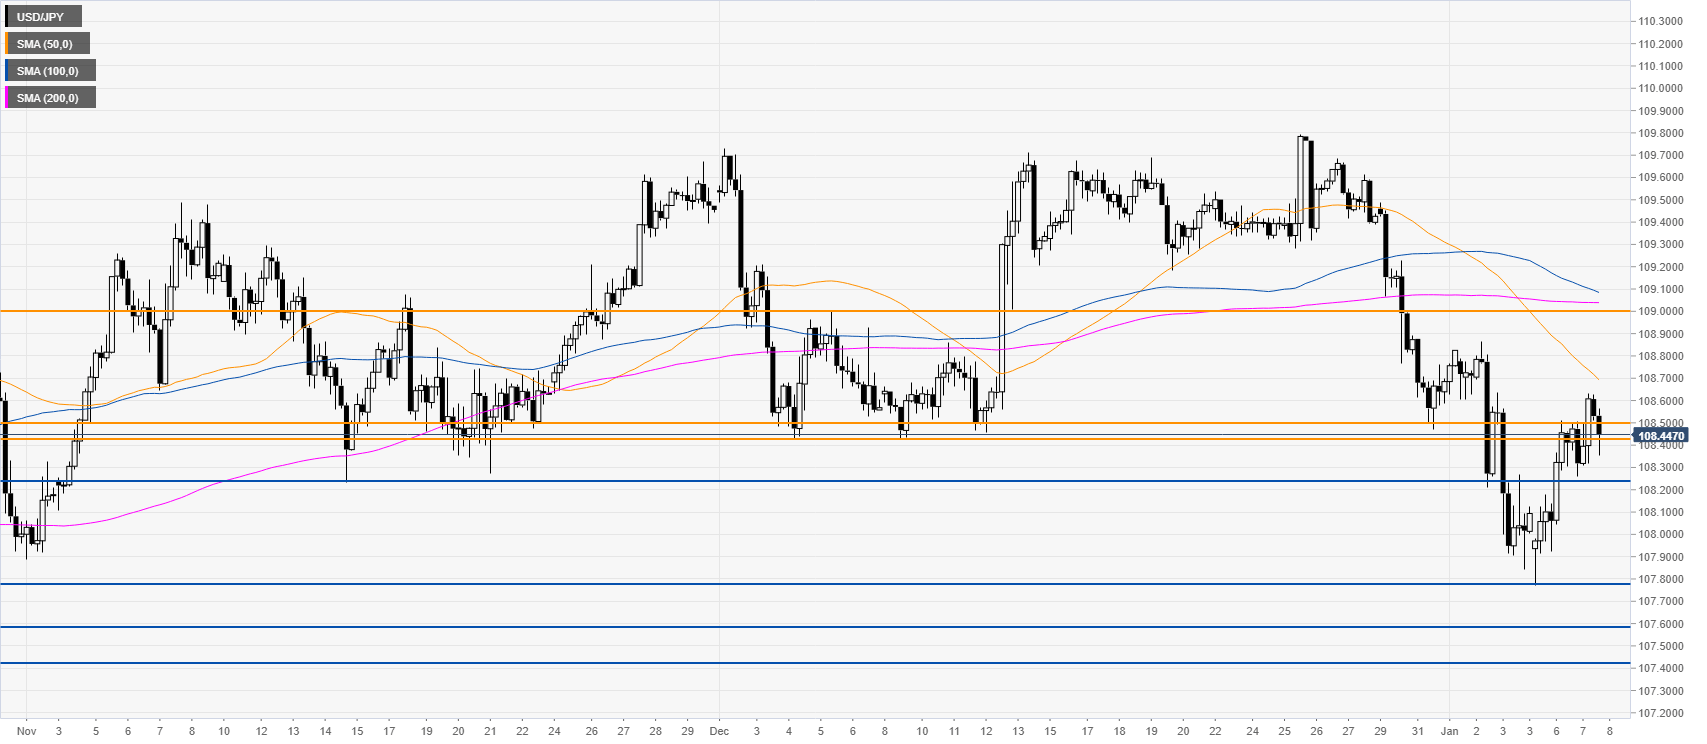
USD/JPY four-hour chart
The market is challenging the 108.45/50 resistance zone. A clear breakout above this level could open the doors to a bullish run to the 109.00 handle. On the flip side, if sellers take control and move below the 108.23 support, the market can lose momentum and decline towards the 107.78, 107.60 and 107.44 price levels, according to the Technical Confluences Indicator.
Additional key levels
