- NZD/USD recovers from a two-week low as the US President Trump says “All is well!”
- Two-month-old rising trend line and 61.8% Fibonacci retracement can challenge sellers during further declines.
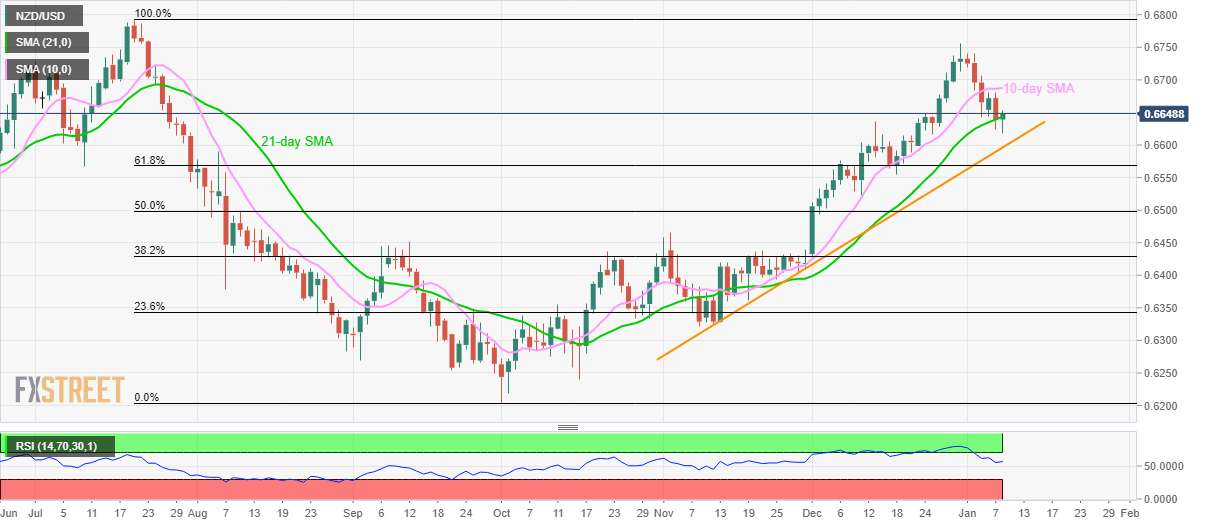
- 10-day SMA offers immediate resistance.
NZD/USD pulls back from the day’s low of 0.6617 to 0.6646 by the press time of the pre-European session on Wednesday. The pair earlier dropped amid fears of the US-Iran war after Iran hit the US bases in Baghdad. However, the quote recovered afterward as the US refrained from any immediate retaliation.
The pair now aims to confront a 10-day SMA level of 0.6688 ahead of targeting 0.6700 round-figure. Though, the major upside will be tamed by the low of 2019-end, near 0.6715.
Should there be further rise past-0.6715, July 2019 top surrounding 0.6800 will be in the spotlight.
Alternatively, pair’s sustained trading below 21-day SMA level of 0.6640 can drag it to an upward sloping trend line since early November, at 0.6595.
In a case the support line fails to tame bears, 61.8% Fibonacci retracement level of July-October fall, at 0.6568, followed by December 11 low near 0.6520, will gain the market’s attention.
NZD/USD daily chart
Trend: Bullish
