- EUR/USD drops to a two-week low, registers three-day losing streak.
- Bearish MACD indicates extended downside to 50-day SMA.
- A three-month-old rising trend line adds to the support.
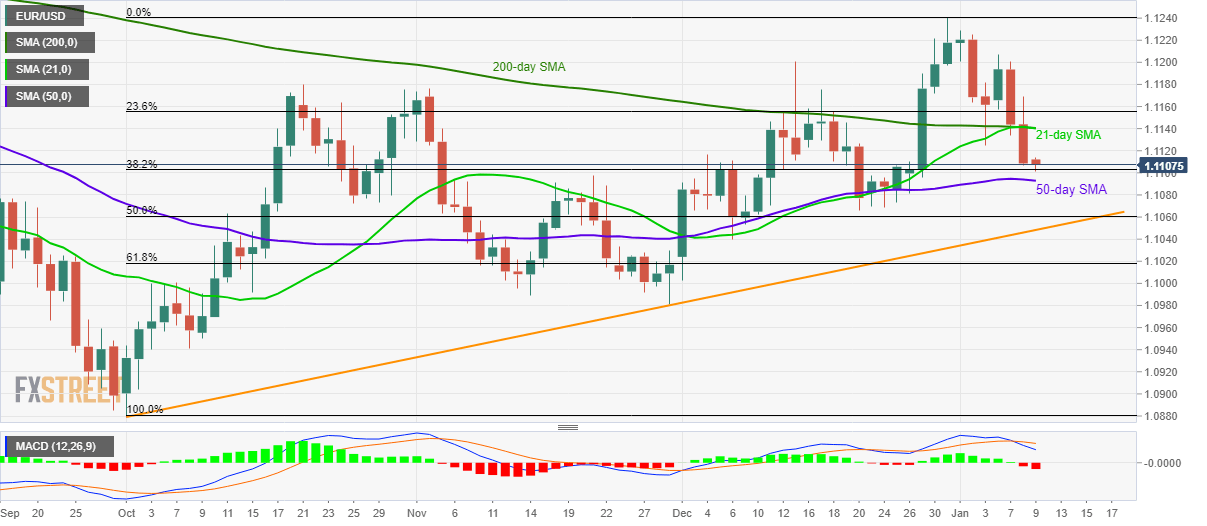
EUR/USD declines to 1.1107 amid the initial Asian session on Thursday. The pair traders near the lowest levels in two-week, while being on the back foot for the third day in a row, as it breaks the key SMA confluence the previous day.
With this, sellers may keep a 50-day SMA level of 1.1093 as the immediate target whereas 50% Fibonacci retracement of October-December upside, at 1.1060, could lure them afterward.
However, an upward sloping trend line since October-start, at 1.1048, could restrict the pair’s further downside.
It’s worth mentioning that the 12-day MACD indicator flashes bearish signs.
On the upside, EUR/USD prices need to close beyond the confluence of 21 and 200-day SMA, at 1.1140, to cross the 1.1200 round-figure and aim for the week’s high near 1.1210. In doing so, the 1.1240 top could regain the Bull’s attention.
EUR/USD daily chart
Trend: Bearish
