- USD/JPY is bouncing up strongly trading at its highest since the start of January.
- Resistances are seen at 109.50 and 109.90 levels.
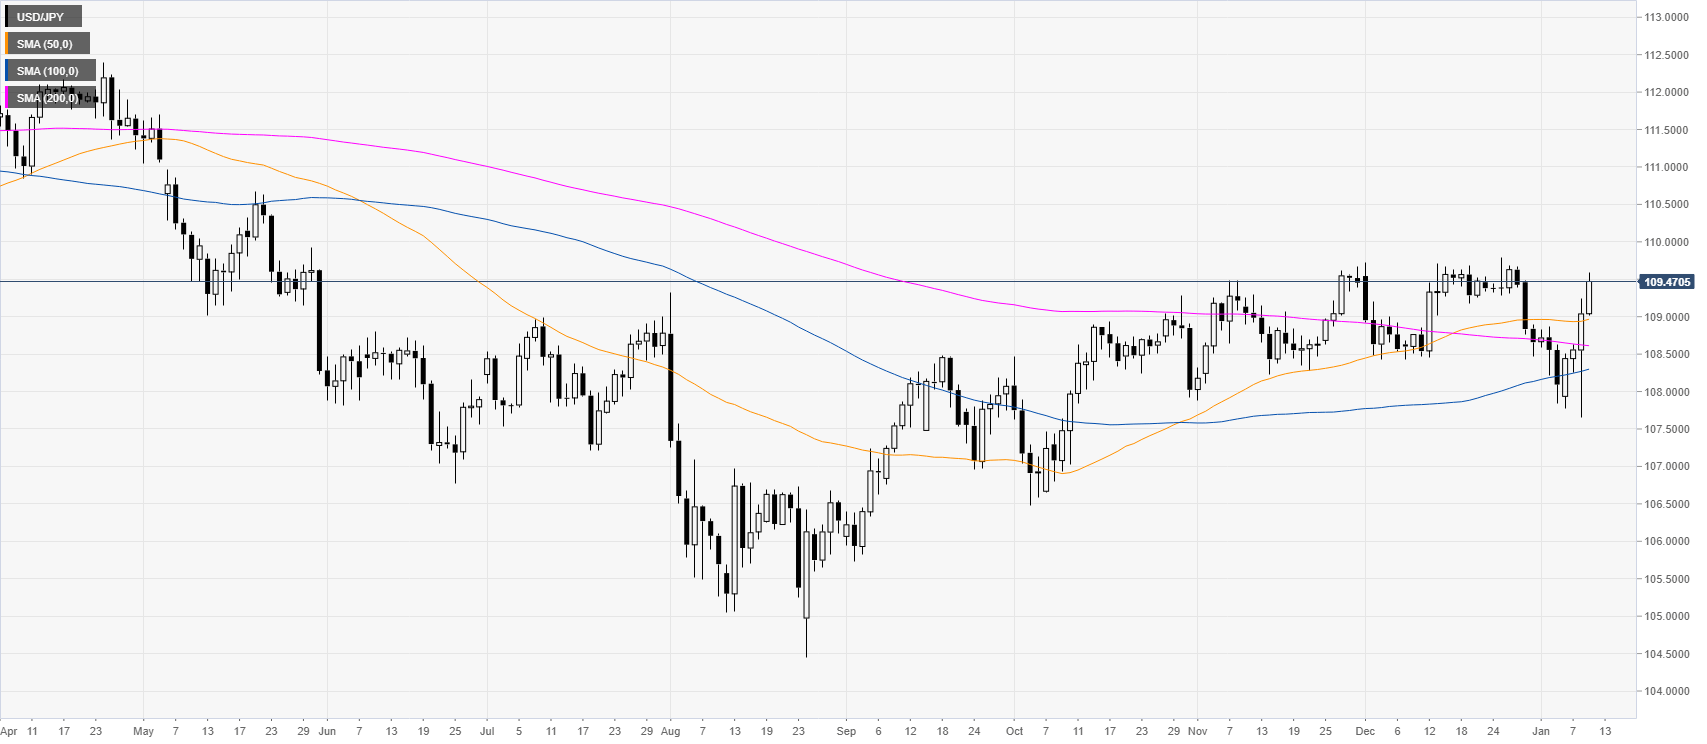
USD/JPY daily chart
USD/JPY is bouncing strongly from the 108.00 handle as the spot is regaining momentum above the main simple moving averages (SMAs).
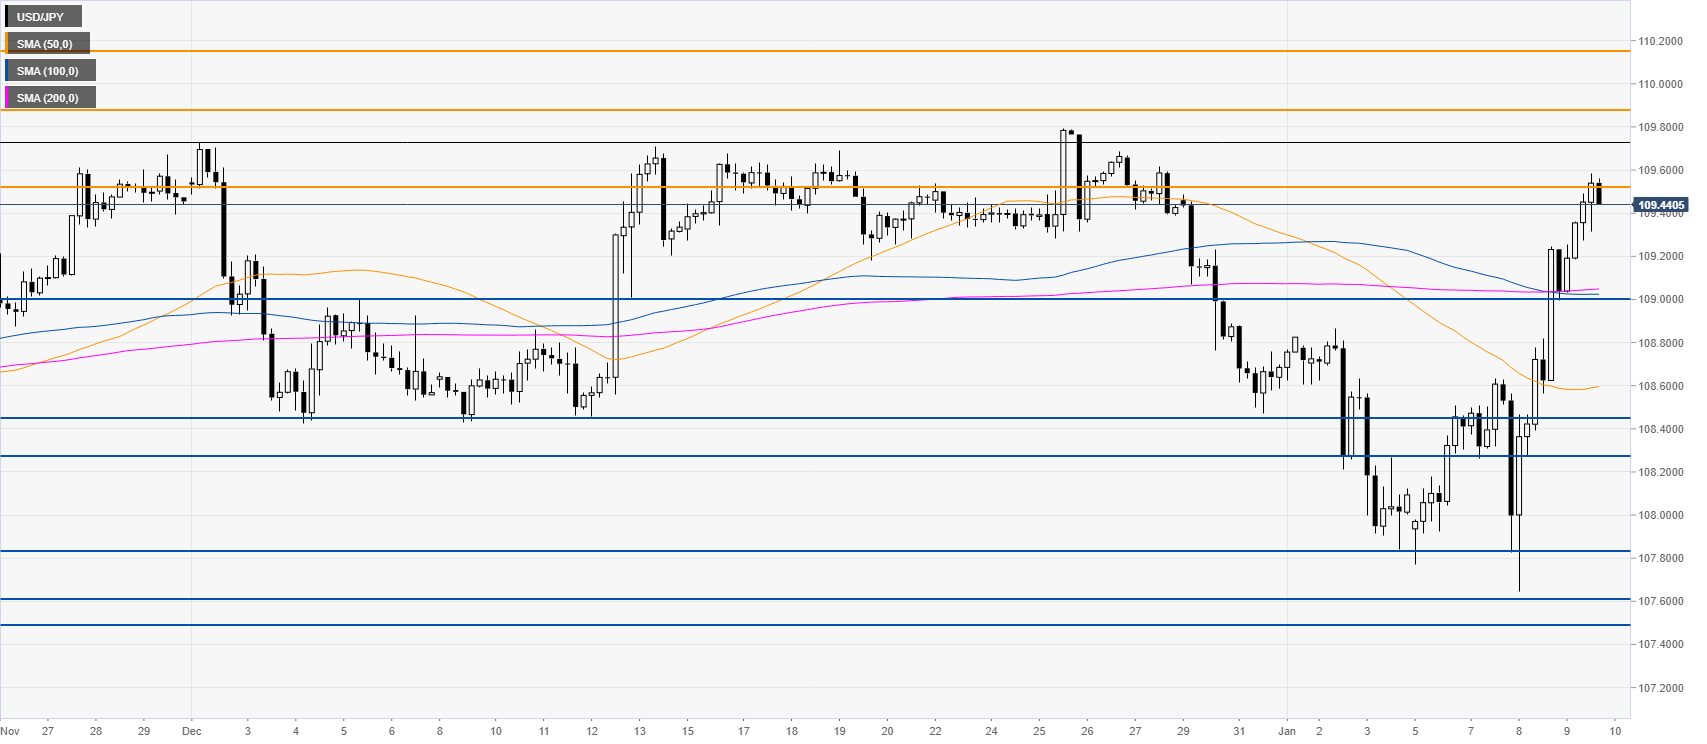
USD/JPY four-hour chart
The spot pushed its way higher to the 109.50 resistance. However, this can be a tough nut to crack and the market can enter a consolidation now, potentially in the 109.00/109.50 range. In the event the bulls extend the run the 109.90 and 110.15 level can provide resistance. On the flip side, the bearish case would involve a break of 109.00 support and a drop towards the 108.45/28 price zone, according to the Technical Confluences Indicator.
 ,
,Additional key levels
