- GBP/USD snaps four-day-old winning streak.
- An upward sloping trend line since early-November will restrict the pair’s downside below 50-day SMA.
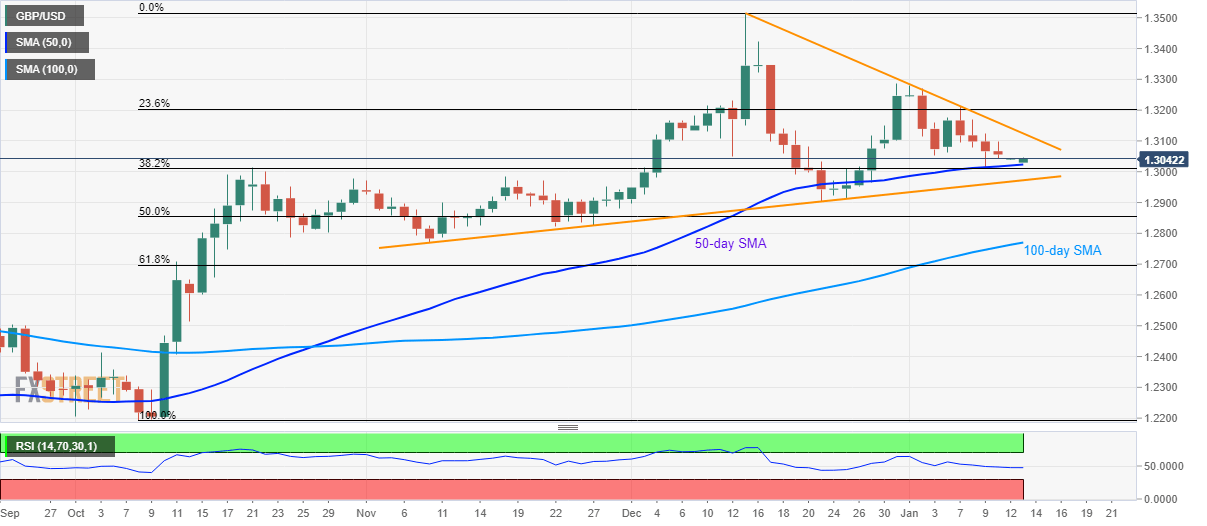
GBP/USD turns mildly bid to 1.3042 amid Monday’s Asian session. The pair fails to extend the previous four-day fall while taking a U-turn from 50-day SMA.
Even so, prices are likely to find challenges in extending the recent recovery unless breaking a descending trend line since December 13, at 1.3125 now.
If the quote remains strong above 1.3125, it can easily aim for the monthly top surrounding 1.3180 while targeting 1.3300 round-figure during further upside.
Alternatively, pair’s declines below 50-day SMA level of 1.3023 will be capped by a two-month-old rising trend line, near 1.2970.
In a case where the Bears dominate past-1.2970, November month low and 100-day SMA, around 1.2770, will become their favorite.
GBP/USD daily chart
Trend: Sideways
