- AUD/USD trades positive for the second consecutive day, towards 21-day SMA.
- 50% Fibonacci retracement and ascending trend line since early-October cap near-term declines.
AUD/USD takes the bids to 0.6911 during the early Monday. In doing so, the pair extends recovery gains beyond 200-day SMA, which in turn pushes buyers towards a 21-day SMA level of 0.6925.
Even so, highs marked in October and December months around 0.6930/40 will restrict pair’s further upside, if not then 0.7000 will offer an intermediate halt during the run-up to the monthly top around 0.7040.
Meanwhile, pair’s declines below 200-day SMA Level of 0.6890 can fetch the quote to 50% Fibonacci retracement of October-December upside, at 0.6856.
It’s worth mentioning that the pair’s downside below 0.6856 will be challenged by an upward sloping trend line since early-October, at 0.6815.
AUD/USD daily chart
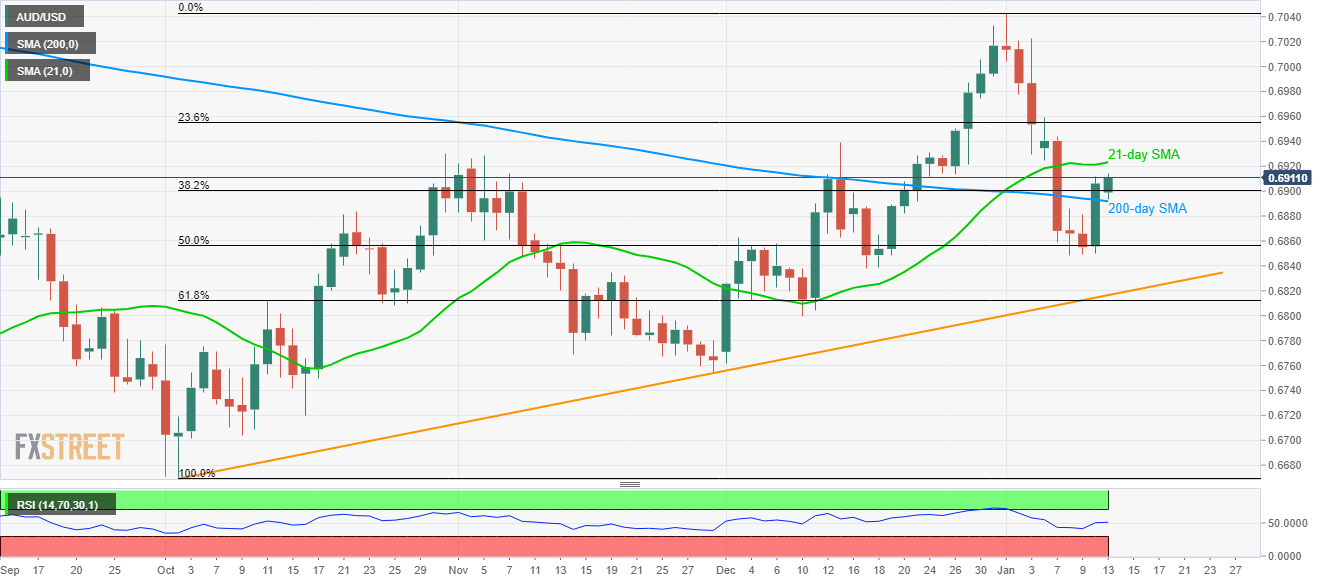
Trend: Bullish
