- WTI struggles to extend the recent pullback from a 3.5-month-old rising support line and 200-day SMA.
- 50-day SMA caps the immediate upside, 61.8% Fibonacci retracement adds to the support.
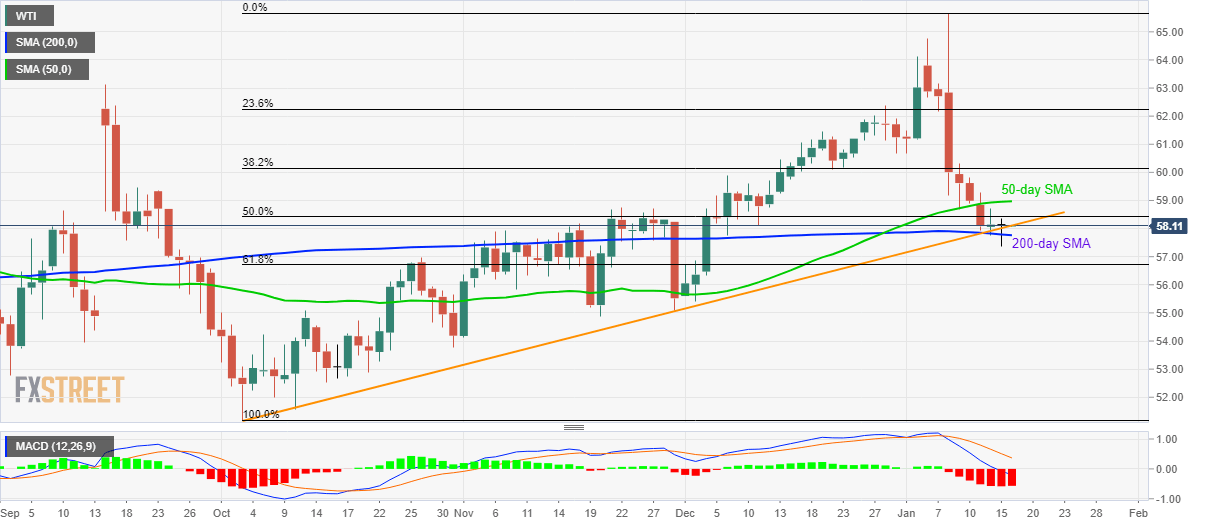
WTI trades near $58.10 during Thursday’s Asian session. The black gold recently took a U-turn from 200-day SMA and an ascending trend line since early October. However, 50-day SMA holds the key to the pair’s further upside.
As a result, buyers will look for entry beyond $59.00 while aiming for 38.2% Fibonacci retracement of the October-January rise, at $60.15.
Should WTI oil prices stay positive beyond $60.15, the 23.6% of Fibonacci retracement, near $62.25, becomes important to watch.
Meanwhile, the bears will look for entry below a 200-day SMA level of $57.75. In doing so, 61.8% of Fibonacci retracement, at $56.70, will be their next target.
In a case where the quote remains weak under $56.70, November 29 low near $55 will be on the seller’s radar.
WTI daily chart
Trend: Pullback expected
