- AUD/USD stays positive above 200-day SMA, 38.2% Fibonacci retracement.
- Bearish candlestick formation, MACD doubts the recent strength.
- 0.7000 becomes the key resistance.
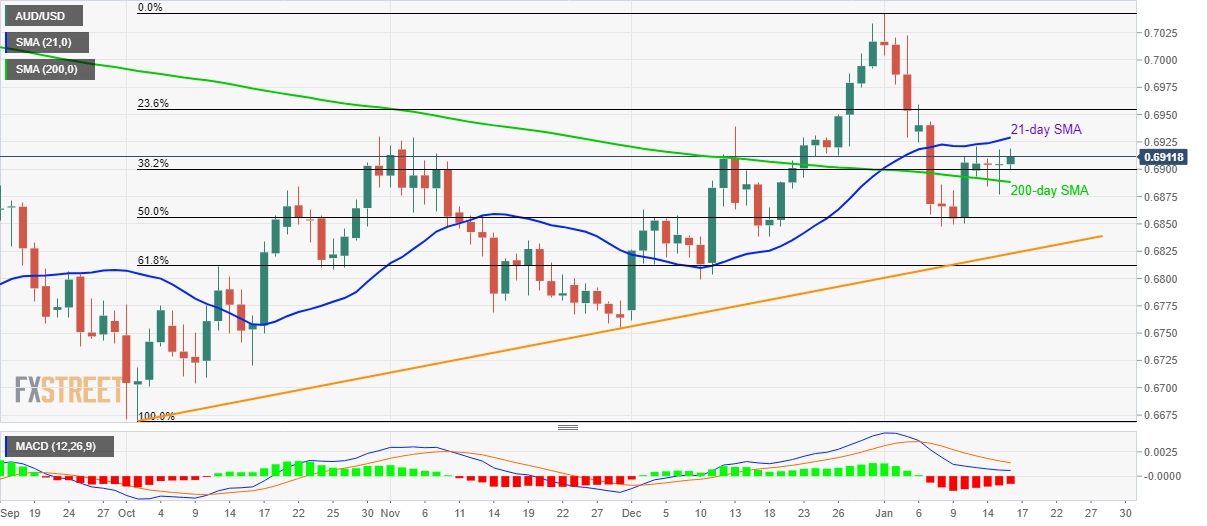
AUD/USD rises to 0.6920 during the early trading hours of Thursday. The Aussie pair flashed a bearish candlestick formation, Doji, on the daily chart on Wednesday. Also increasing the odds of the pair’s pullback is bearish MACD.
Even so, a 200-day SMA level around 0.6890/85 keeps the pair’s short-term downside limited, a break of which can fetch AUD/USD prices to 50% Fibonacci retracement of pair’s October-January month upside, at 0.6855.
During the pair’s weakness below 0.6855, an upward sloping trend line since early October at 0.6823 and 61.8% of Fibonacci retracement near 0.6810 will be important to watch.
On the flip side, the pair’s daily closing above 21-day SMA level of 0.6930 enables the pair to challenge a 23.6% Fibonacci retracement level of 0.6955.
In a case where the buyers manage to cross 0.6955, 0.7000 round-figure will be on their radar.
AUD/USD daily chart
Trend: Pullback expected
