- GBP/JPY seesaws near the two-week top, extends run-up beyond 23.6% Fibonacci retracement of the pair’s October-December 2019 upside.
- A downside break will have a 21-day SMA and support-line of the short-term triangle as challenging the bears.
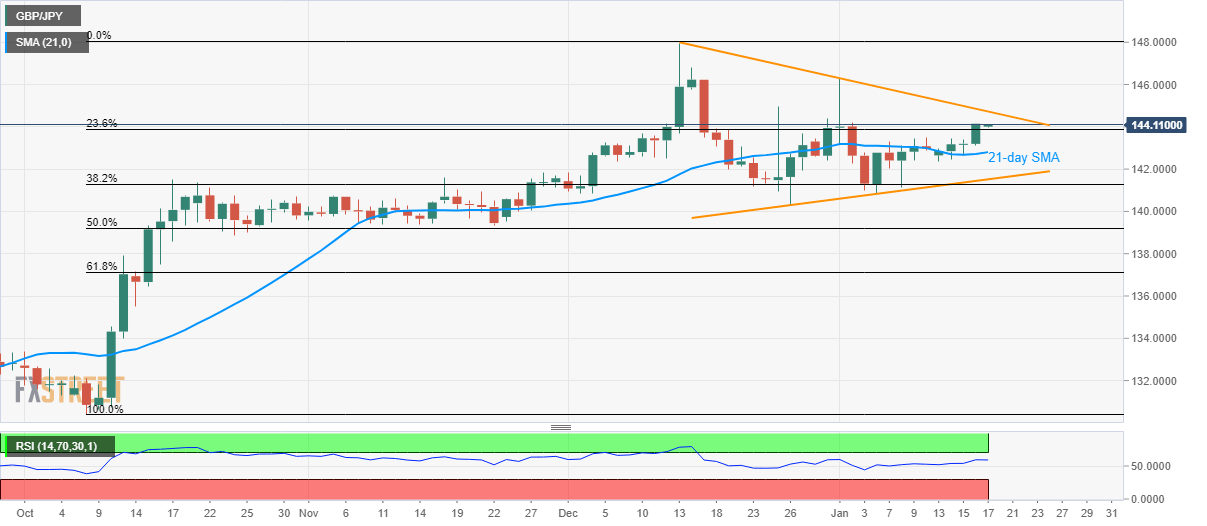
GBP/JPY takes the bids to 144.15 during Friday’s Asian session. The pair stays positive above 23.6% Fibonacci retracement of the pair’s October-December 2019 upside, which in turn shifts buyers’ focus to a downward sloping trend line stretched from December 13.
Should prices stay strong beyond 144.75 level comprising the aforementioned resistance-line, the yearly top surrounding 146.30 will return to the chart.
In a case where the bulls keep dominating past-146.30, 146.80 and 148.00 could offer intermediate halts during the rise to 150.00 psychological mark.
Meanwhile, a downside break of 23.6% Fibonacci retracement, at 143.85, can fetch the quote back to 21-day SMA, at 142.80 now.
Though, a three-week-old rising trend line and 38.2% Fibonacci retracement could challenge the bears amid the following declines around 141.50 and 141.30 respectively.
GBP/JPY daily chart
Trend: Bullish
