- NZD/USD registers three-day winning-streak following a bounce off 38.2% Fibonacci retracement level.
- The downside break of 200-day SMA will negate the chances of pair’s upside.
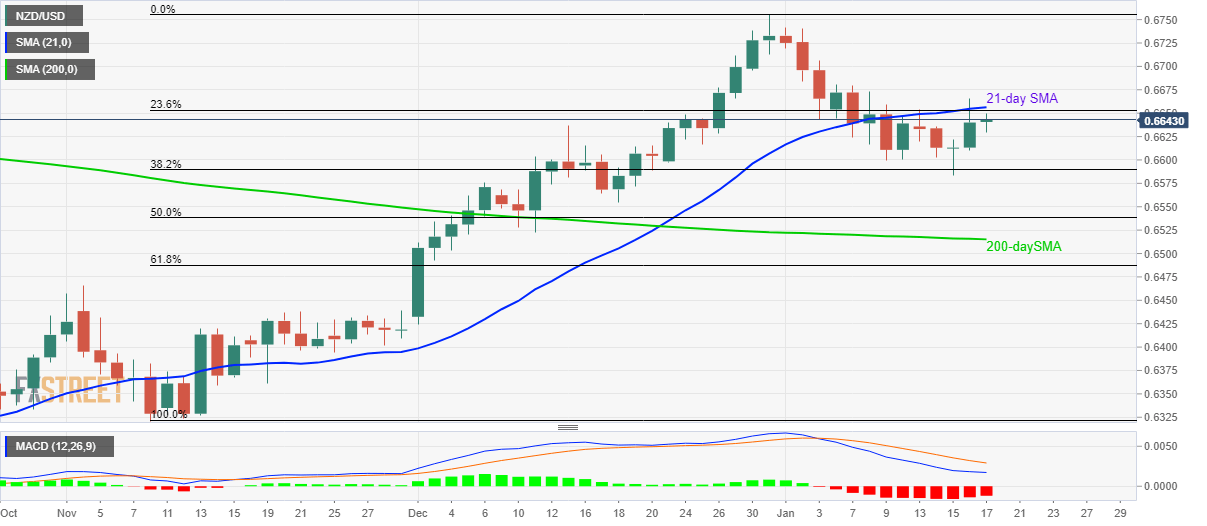
NZD/USD stays mildly bid near 0.6645 while heading into the European session on Friday. The pair recovered from 38.2% Fibonacci retracement of its November-December 2019 upside. Though, a confluence of 21-day SMA and 23.6% Fibonacci retracement restrict the pair’s upside off-late.
With this, bearish MACD gains the market’s attention if prices slip below 38.2% Fibonacci retracement of 0.6590. As a result, December 18 low near 0.6550 could be sellers’ favorite ahead of confronting a 200-day SMA level of 0.6515.
Meanwhile, pair’s rise beyond the 0.6655/60 confluence could push it towards 0.6700 and then to December 2019 top surrounding 0.6760.
In a case where the bulls dominate past 0.6760, July 2019 high around 0.6795 could be in focus. Alternatively, the NZD/USD price drop below 0.6515 can recall early-November peak near 0.6465.
NZD/USD daily chart
Trend: Pullback expected
