- EUR/USD fails to cross the confluence of 50-day SMA and 38.2% Fibonacci retracement.
- 23.6% Fibonacci retracement, a three-week-old falling trend line add to the resistance.
- An ascending support line since early October offers additional rest below 100-day SMA.
EUR/USD declines to 1.1090 during early Tuesday. That said, the pair failed to cross the confluence of 50-day SMA and 38.2% Fibonacci retracement of its October 01 to December 31 rise during the previous day.
As a result, the quote is expected to revisit the 100-day SMA support level of 1.1073. However, an upward sloping trend line since early-October, at 1.1068 could restrict the pair’s further downside.
In a case where sellers dominate below 1.1068, 50% And 61.8% Fibonacci retracement levels of 1.1060 and 1.1015 will return to the charts.
Meanwhile, pair’s sustained break above 1.1100/05 resistance confluence can trigger fresh recovery to 1.1130 and then to 23.6% Fibonacci retracement, a three-week-old falling trend line around 1.1155/60.
EUR/USD daily chart
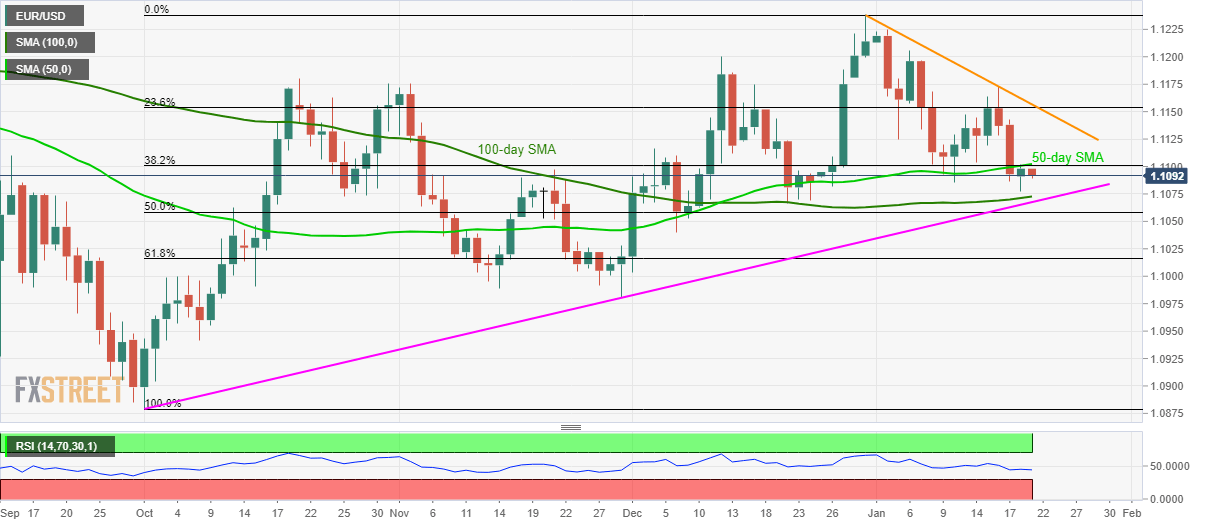
Trend: Bearish
