- NZD/USD stays under pressure for the third consecutive day, nears short-term key support.
- The pair has been trading below 21-day SMA, 23.6% Fibonacci retracement for the last two weeks.
- The pair’s further downside can benefit from bearish MACD.
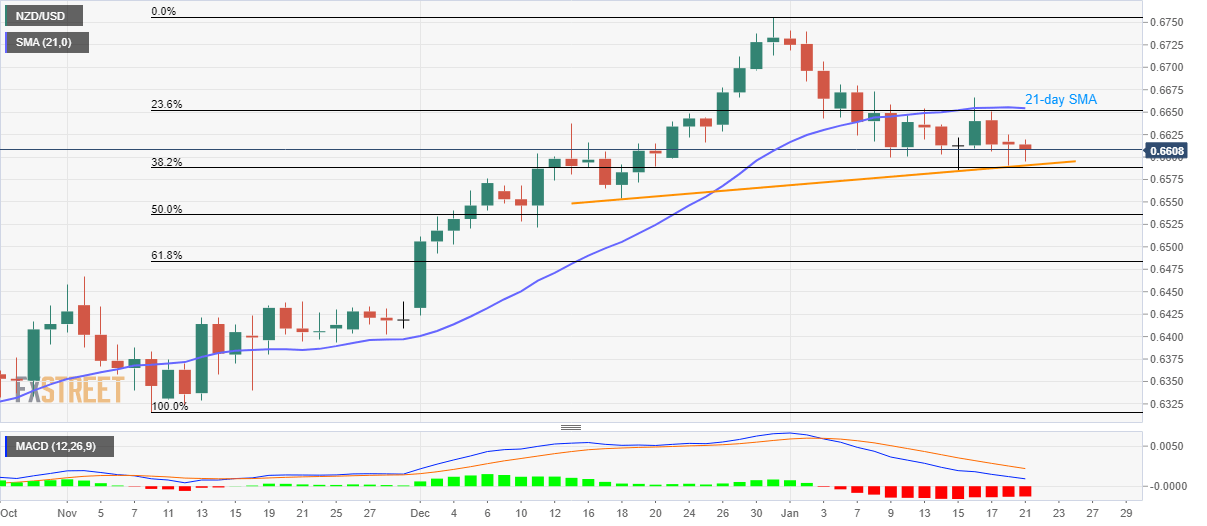
NZD/USD remains on the back foot while trading around 0.6607 during the pre-European session on Tuesday. The pair nears an upward sloping trend line since December 18 as well as 38.2% Fibonacci retracement level of the pair’s November-December upside.
Should bearish MACD drag NZD/USD prices below 0.6590/88 support confluence, 50% Fibonacci retracement near 0.6535 could gain the market’s attention.
During the pair’s further downside past-0.6535, 0.6500 and November 04 top near 0.6465 can please the sellers.
On the contrary, 21-day SMA and 23.6% Fibonacci retracement restrict short-term upside around 0.6650/55.
Buyers will wait for a daily closing beyond 0.6655 to aim for 0.6700 and 2019 close near 0.6755.
NZD/USD daily chart
Trend: Pullback expected
