- DXY is trading withing an inverse head-and-shoulder pattern with potential bullish implications.
- Bullish targets can be seen near 97.85 and 98.20 levels.
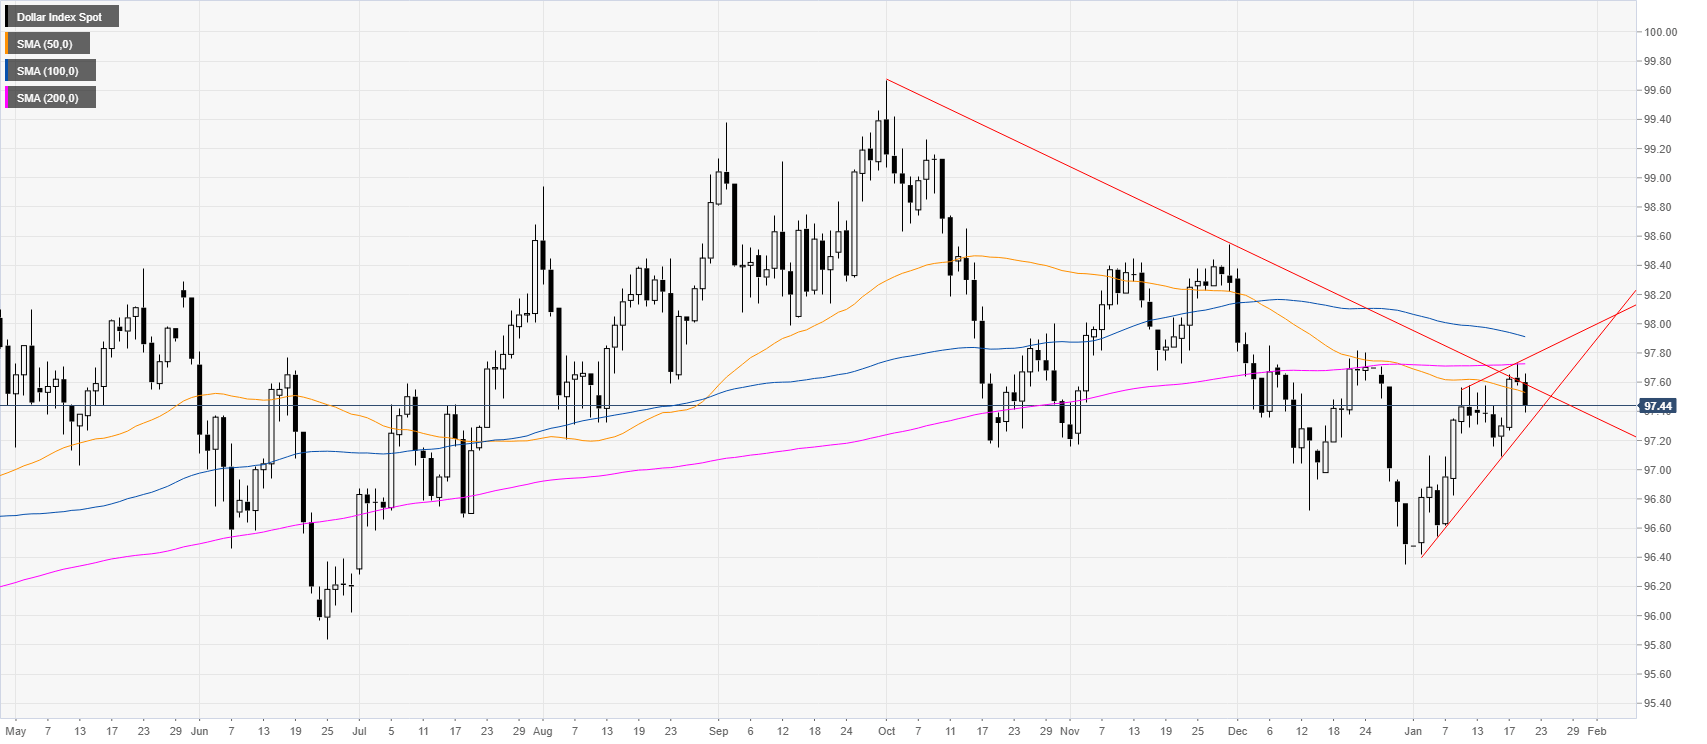
DXY daily chart
The US Dollar Index (DXY) is easing from the January highs, a descending trendline originating from October 2019 and the 200-day simple moving average (SMA). The greenback is also trading within a bullish channel with a wedged-shaped.
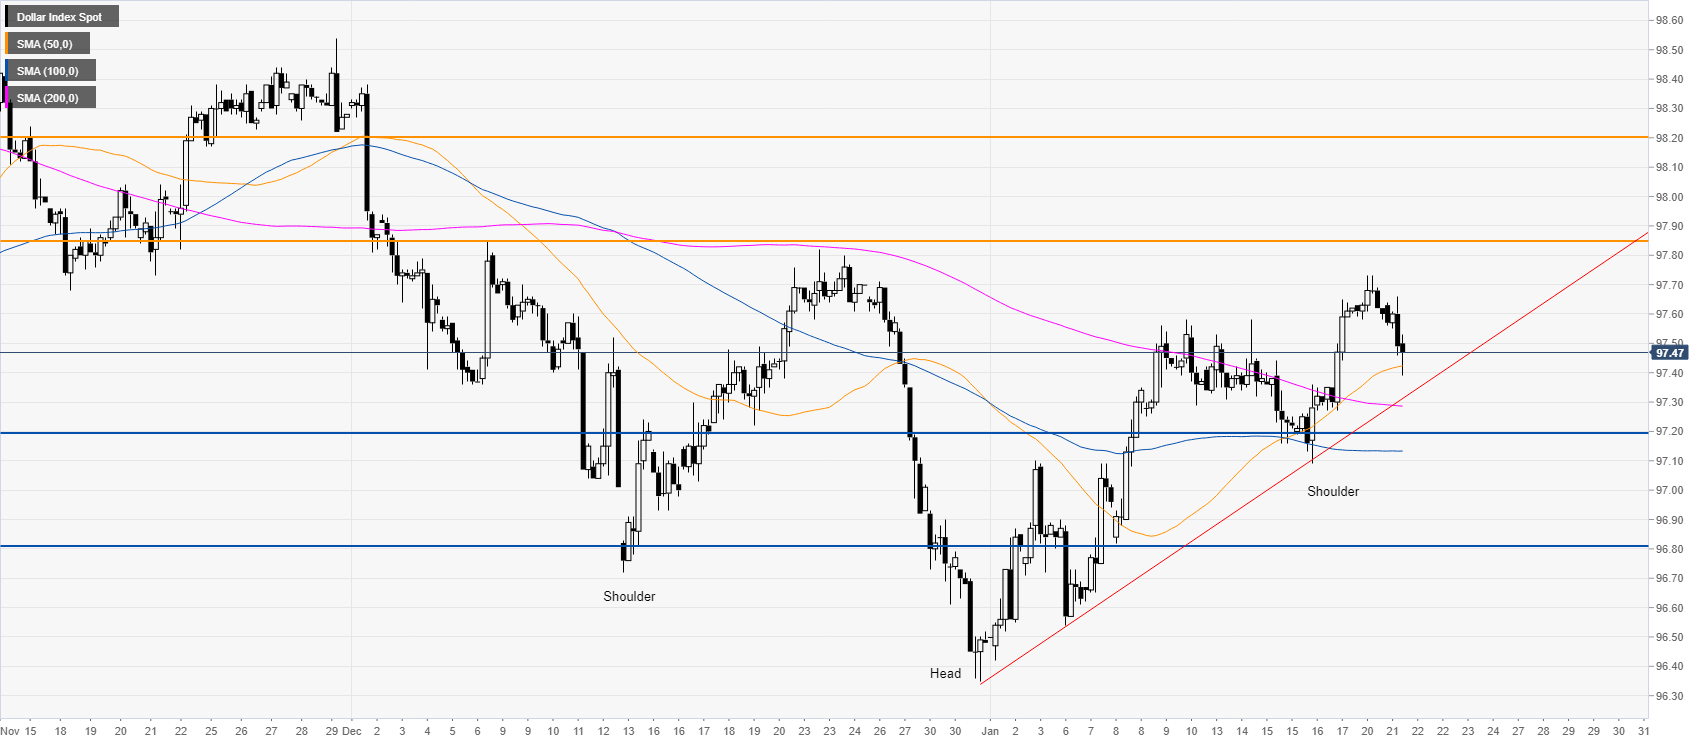
DXY four-hour chart
DXY is evolving above the main simple moving averages (SMAs) and a rising trendline, suggesting a bullish momentum. The market is also in an inverted head-and-shoulder structure therefore it should remain bullish while above the right shoulder and 97.20/10 support zone. If bulls show some conviction they can target 97.85 and 98.20 to the upside.
Additional key levels
