- USD/CHF registers five-day winning streak, rises to a one-week high.
- A downside break of 0.9644 can refresh monthly lows.
- 38.2% Fibonacci retracement could lure buyers during further upside.
USD/CHF takes the bids to 0.9700, following the intra-day high of 0.9702, while heading into the European session on Wednesday.
The pair nears the key short-term resistance confluence including 21-day SMA 23.6% Fibonacci retracement of the pair November-January fall and a descending trend line since December 06 around 0.9707/13.
Should prices manage to provide a daily closing beyond 0.9717, an extended run-up to 38.2% Fibonacci retracement level of 0.9770 can’t be ruled out.
Meanwhile, lows marked on December 31 and January 17 highlights 0.9644 as the immediate support, a break of which could push the bears towards refreshing the 16-month low towards 0.9600 round-figure and then to September 2018 bottom surrounding 0.9540.
USD/CHF daily chart
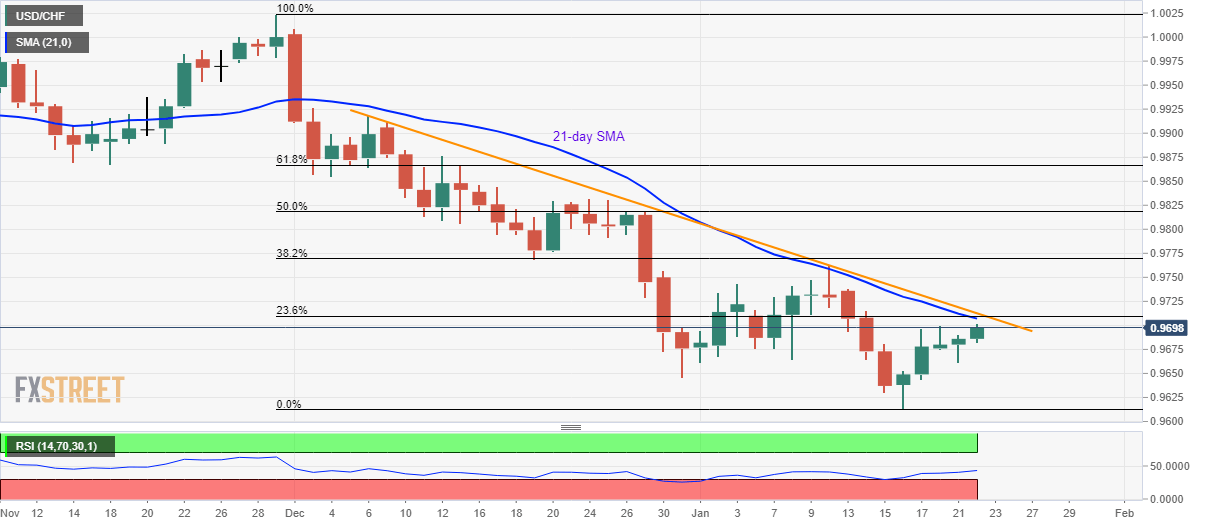
Trend: Pullback expected
