- The inverse head-and-shoulders formation is set to lead to a bullish extension.
- Bullish targets can be located near 97.85 and 98.20 levels.
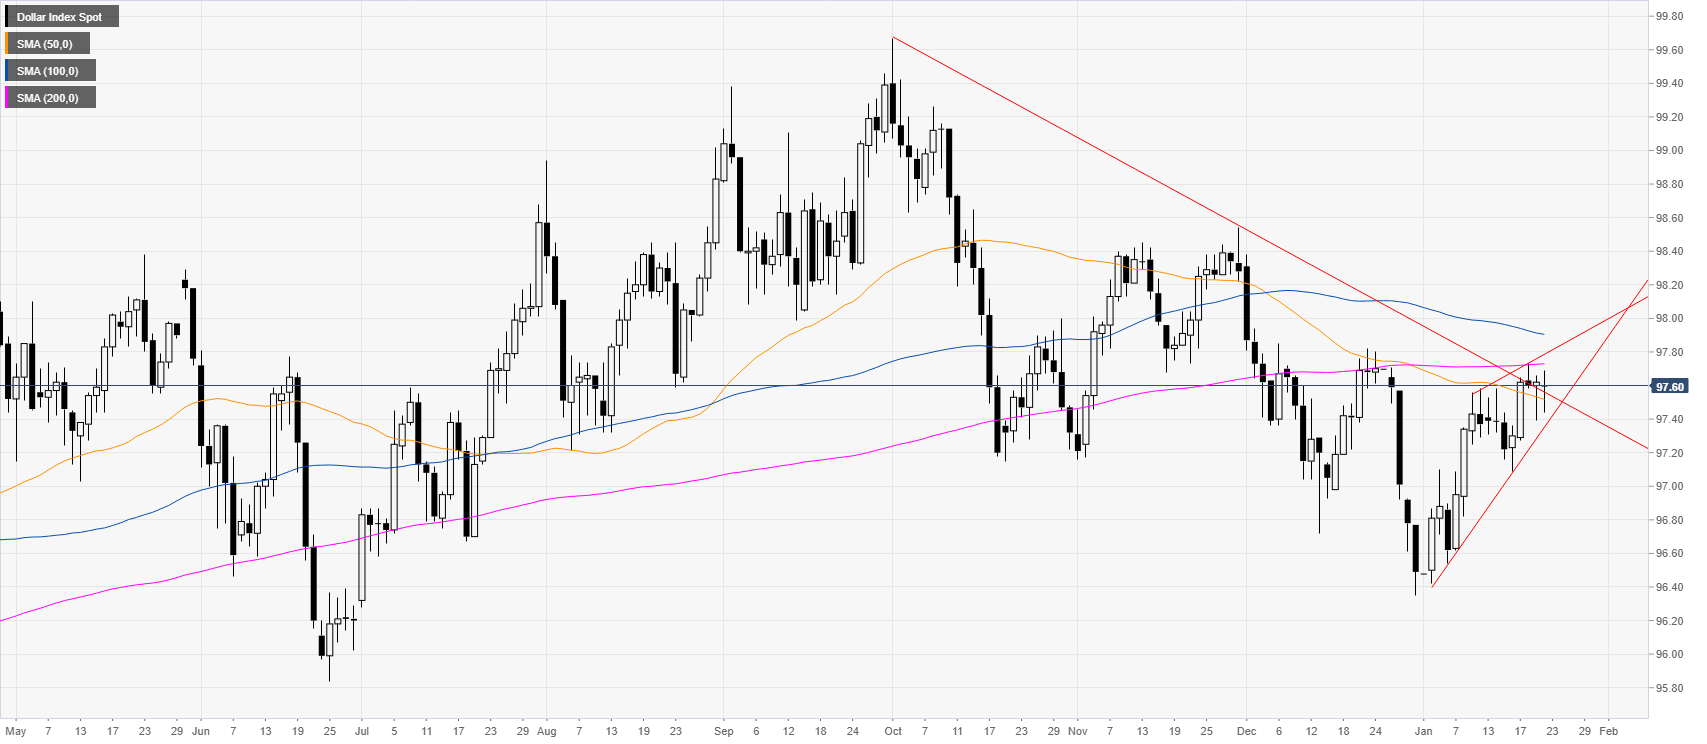
DXY daily chart
The US Dollar Index (DXY) is trapped between the 50 and 200-day simple moving average (SMA) while trading within a rising wedge channel. On Thursday, the market will be focusing on the ECB monetary policy statement.
DXY four-hour chart
DXY is trading above its main simple moving averages (SMAs) and an ascending trendline, suggesting a bullish bias in the medium term. The buck is also in an inverted head-and-shoulder formation and DXY is set to remain bullish while trading above the right shoulder and the 97.20/10 support zone. If buyers lift the market they could reach the 97.85 and 98.20 levels on the way up.
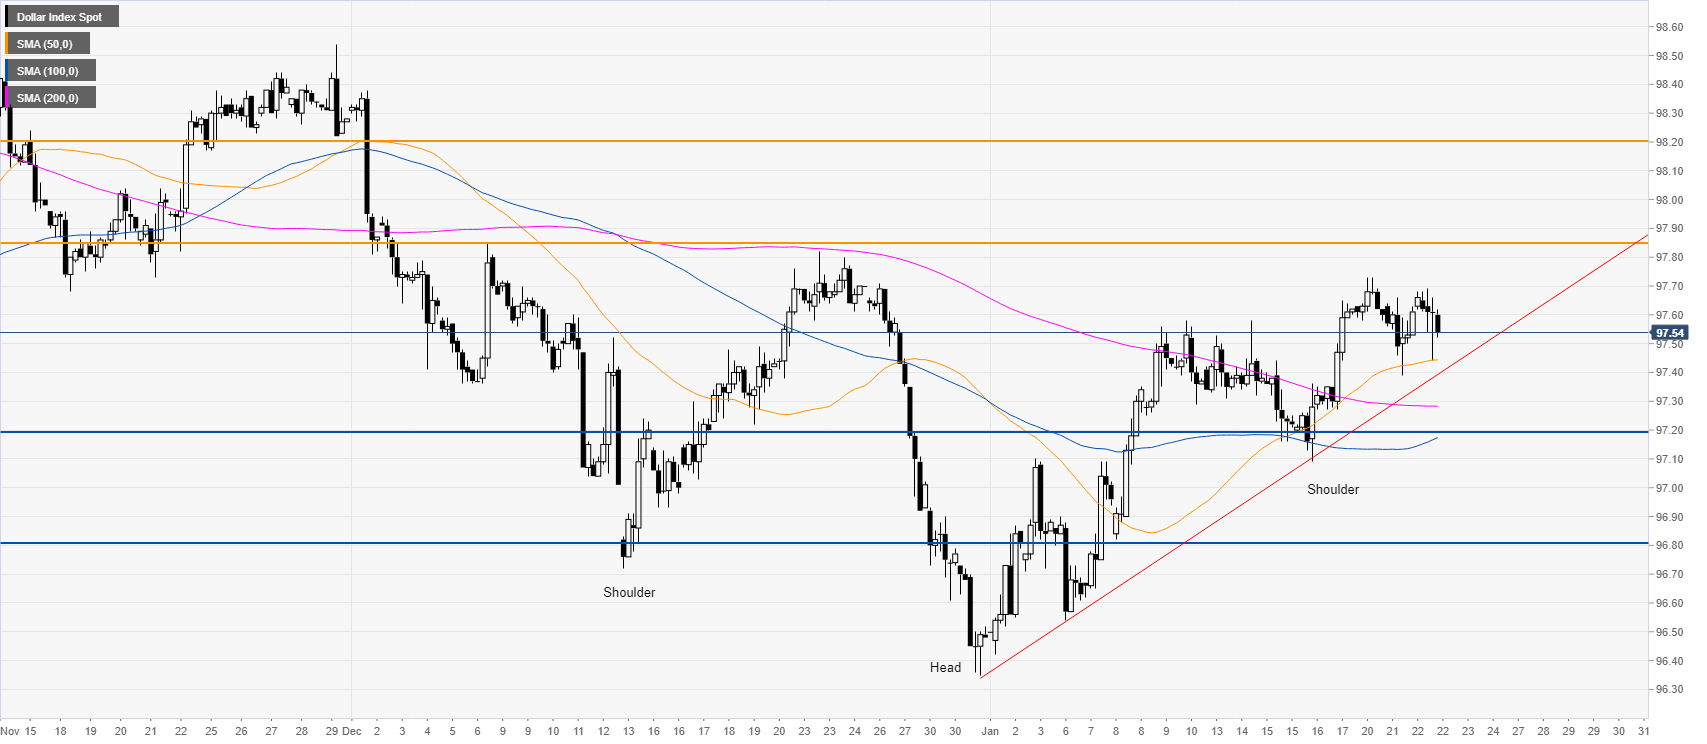
Additional key levels
