- GBP/USD trades near two-week high, struggles to extend run-up towards 50% and 61.8% Fibonacci retracement levels.
- Seller may target 200-bar SMA, monthly falling trend line during fresh declines.
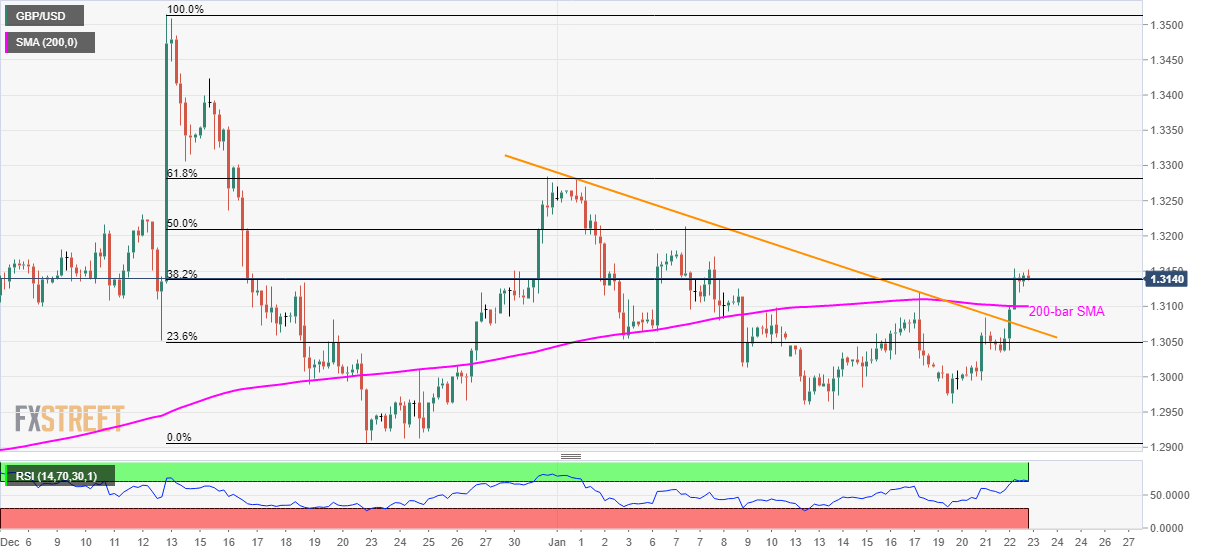
GBP/USD seesaws near 1.3140 with a little movement during the Asian session on Thursday. The pair rose beyond the monthly resistance line and 200-bar SMA the previous day.
Even so, the bulls are struggling around 38.2% Fibonacci retracement of the pair’s declines from December 12 to 23 amid overbought RSI conditions.
As a result, sellers are looking for fresh entry targeting 200-bar SMA level and the resistance-turned-support line, around 1.3100 and 1.3070 respectively, as the immediate supports.
However, pair’s further declines below 1.3070 may recall 1.3000 and 1.2960/55 area on the charts.
On the flip side, 50% and 61.8% Fibonacci retracement levels, near 1.3210 and 1.3280 respectively, can challenge buyers during further advances.
It should also be noted that the pair’s rise past-1.3280 enables it to aim for December 16 top surrounding 1.3420.
GBP/USD four hour chart
Trend: Pullback expected
