- NZD/USD shows signs of sellers’ exhaustion after Wednesday’s Doji.
- Buyers will wait for entry unless crossing 21-day SMA.
- A multi-month-old rising trend line adds to the support.
NZD/USD registers the least momentum among majors while taking rounds to 0.6595 during early Thursday. The pair almost posted the Doji candle, if we consider a two-pip move as an exception, on Wednesday, which in turn favors pullback of the previous three days’ decline.
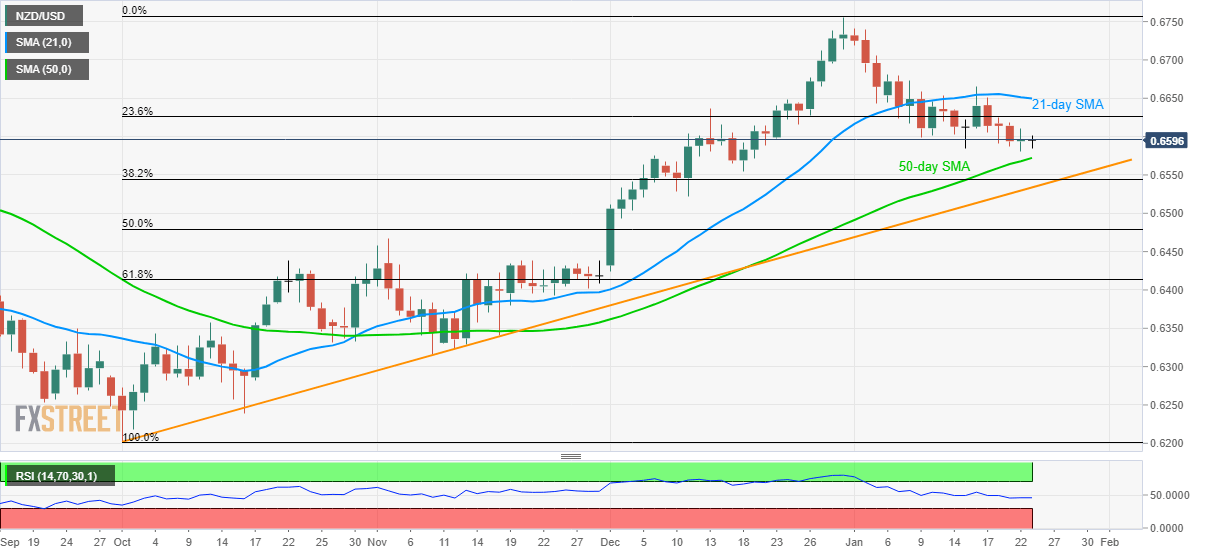
However, the pair needs to cross 23.6% Fibonacci retracement of the pair’s October-December 2019 upside, at 0.6626, as well as 21-day SMA level of 0.6650 to recall the buyers.
In doing so, 0.6682, 0.6700 and 0.6720 can offer intermediate halts during the quote’s run-up to the December 2019 top near 0.6755.
Alternatively, a 50-day SMA level of 0.6572 and an ascending trend line from October-start, at 0.6534, will be short-term key supports to watch.
If at all the quote provides a daily closing below 0.6534, December 11 bottom near 0.6522 and 50% Fibonacci retracement around 0.6480 could lure the bears.
NZD/USD daily chart
Trend: Pullback expected
