- GBP/USD remains on the back foot for the third consecutive day.
- Failures to cross 50% Fibonacci retracement, lower highs from early December favor the bears.
- A multi-week-old rising trend line adds to the support.
GBP/USD stays weak while declining to the intra-day low of 1.3068 by the press time of Monday’s Asian session.
The pair registers three-day losing streak while also forming a lower high pattern if observed its moves from December 2019 top.
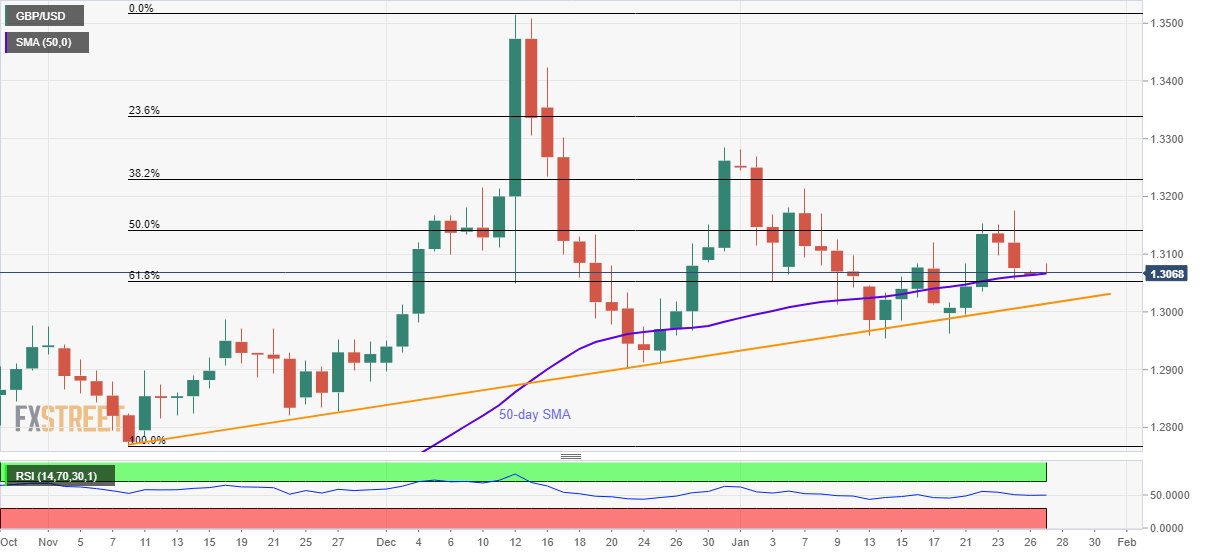
Even so, 50-day SMA and 61.8% Fibonacci retracement of the pair’s November-December upside, around 1.3065 and 1.3050 respectively, challenges the sellers.
If at all GBP/USD prices close below 1.3050, an upward sloping trend line since November 08, at .3015, followed by 1.3000 round-figure, will be the key to watch.
Alternatively, a daily closing beyond 50% Fibonacci retracement of 1.3142 can propel prices towards December 31, 2019’s top near 1.3285.
GBP/USD daily chart
Trend: Pullback expected
