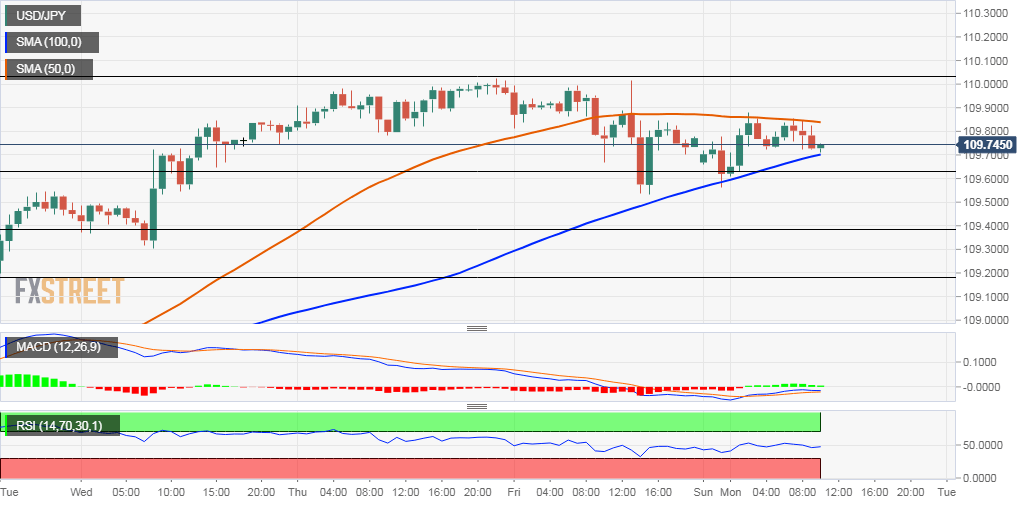
- USD/JPY reverses an early dip to 100-hour SMA/23.6% Fibo. level.
- The intraday uptick lacked any follow-through beyond 50-hour SMA.
- The set-up warrants some caution before placing directional bets.
The USD/JPY pair reversed an early Asian session dip to the 109.55 region and managed to regain some positive traction from a support marked by 100-hour SMA.
The mentioned region coincides with the 23.6% Fibonacci level of the 108.31-110.03 recent positive move and should now act as a key pivotal point for short-term traders.
Meanwhile, the intraday uptick lacked any strong follow-through and remained capped at 50-hour SMA. This is closely followed by the key 110.00 psychological mark.
On the 1-hourly chart, technical indicators have struggled to gain any meaningful traction but managed to maintain their bullish bias on 4-hourly/daily charts.
The technical set-up and diverging oscillators warrant some caution before placing any aggressive directional bets amid continuous worries about the coronavirus.
Hence, it will be prudent to wait for a sustained break through the daily range before traders start positioning for the pair’s next leg of a directional move.
USD/JPY 1-hourly chart
FXStreet Indonesian Site – new domain!
Access it at www.fxstreet-id.com
