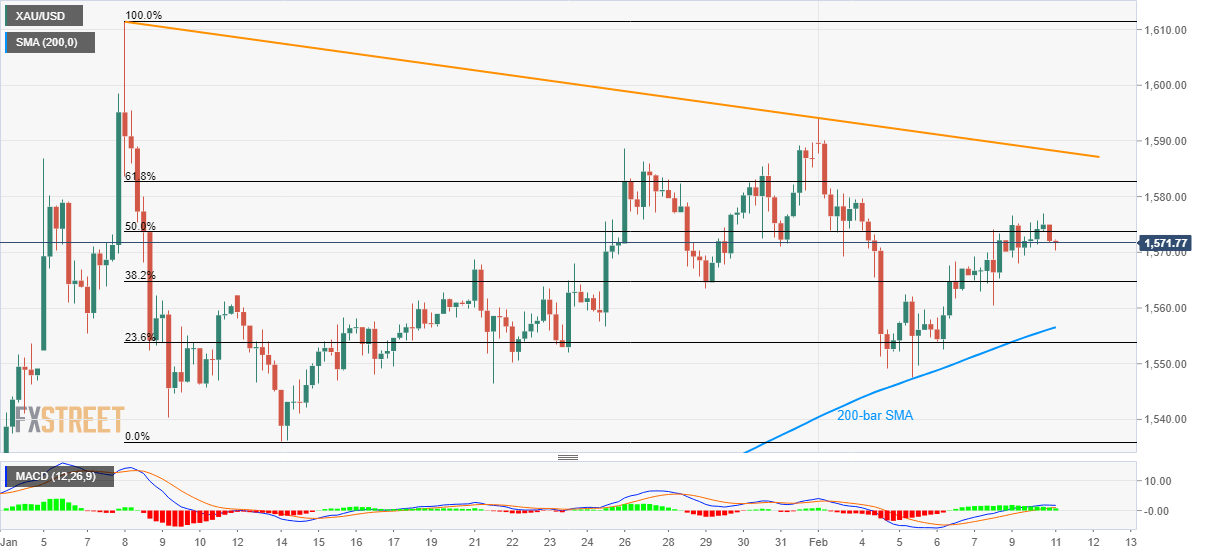
- Gold prices again fail to sustain a break beyond 50% Fibonacci retracement.
- 61.8% Fibonacci retracement, monthly resistance line add to the resistance.
- 200-bar SMA offers strong support amid bullish MACD.
Gold prices decline to the intra-day low of $1,570.35 by the press time of early Tuesday. While repeated failures to hold the break of 50% Fibonacci retracement of early-January portrays the bullion’s weakness, bullish MACD and sustained trading above 200-bar SMA check the sellers.
That said, the precious metal is currently extending the pullback towards a 38.2% Fibonacci retracement level of $1,565 before visiting a 200-bar SMA level of $1,556.50.
However, the quote’s further declines past the key SMA will make it vulnerable to challenge the monthly low surrounding $1,548.
On the contrary, 61.8% Fibonacci retracement level of $1,583 add barriers to the metal’s rise beyond $1,573 immediate resistance comprising 50% of Fibonacci retracement.
It’s worth mentioning that a downward sloping trend line since January 08, currently at $1,588, holds the key to a run-up towards $1,600.
Gold four-hour chart
Trend: Bullish
