- USD/IDR looks for fresh clues following its pullback from 21-day EMA.
- The 50-day EMA, early-January low act as additional upside barriers.
- Bears could aim for the yearly bottom on the break of the triangle.
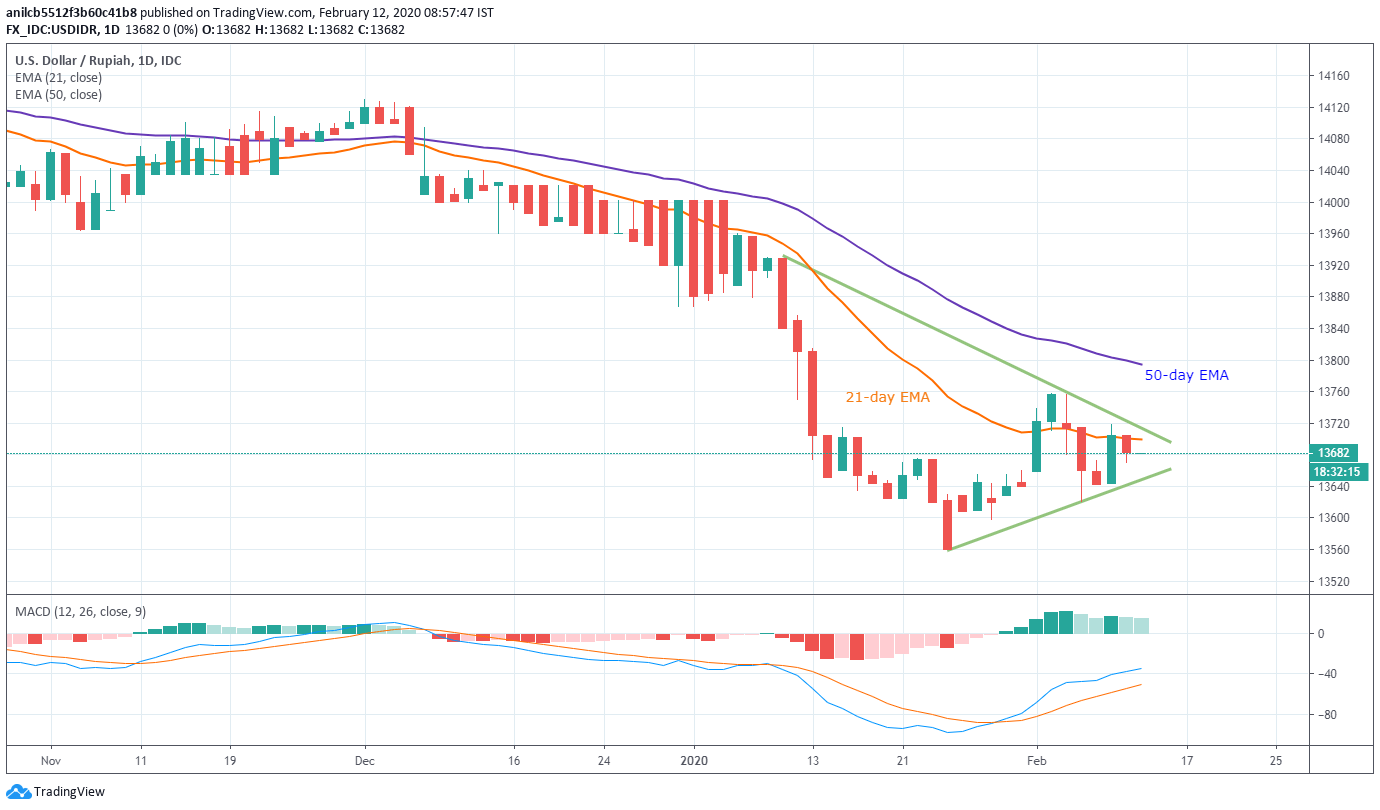
Following its failure to cross 21-day EMA, USD/IDR stays modestly changed to 13,680 during early Wednesday. In doing so, the quote remains inside a short-term symmetrical triangle formation established from early January.
That said, the pair’s latest pullback can drag it to the pattern support, around 13,640, during further declines.
However, the extended weakness by the USD/IDR prices below 13,640 will not hesitate to challenge the yearly low surrounding 13,560.
Alternatively, a 21-day EMA level of 13,700 and the triangle’s resistance line near 13,720 could question the pair’s immediate upside.
If at all the pair manages to cross 13,720 on a daily closing basis, a monthly top near 13,760 and 50-day EMA around 13,800 could appear on the bulls’ radar.
USD/IDR daily chart
Trend: Sideways
FXStreet Indonesian Site – new domain!
Access it at www.fxstreet-id.com
