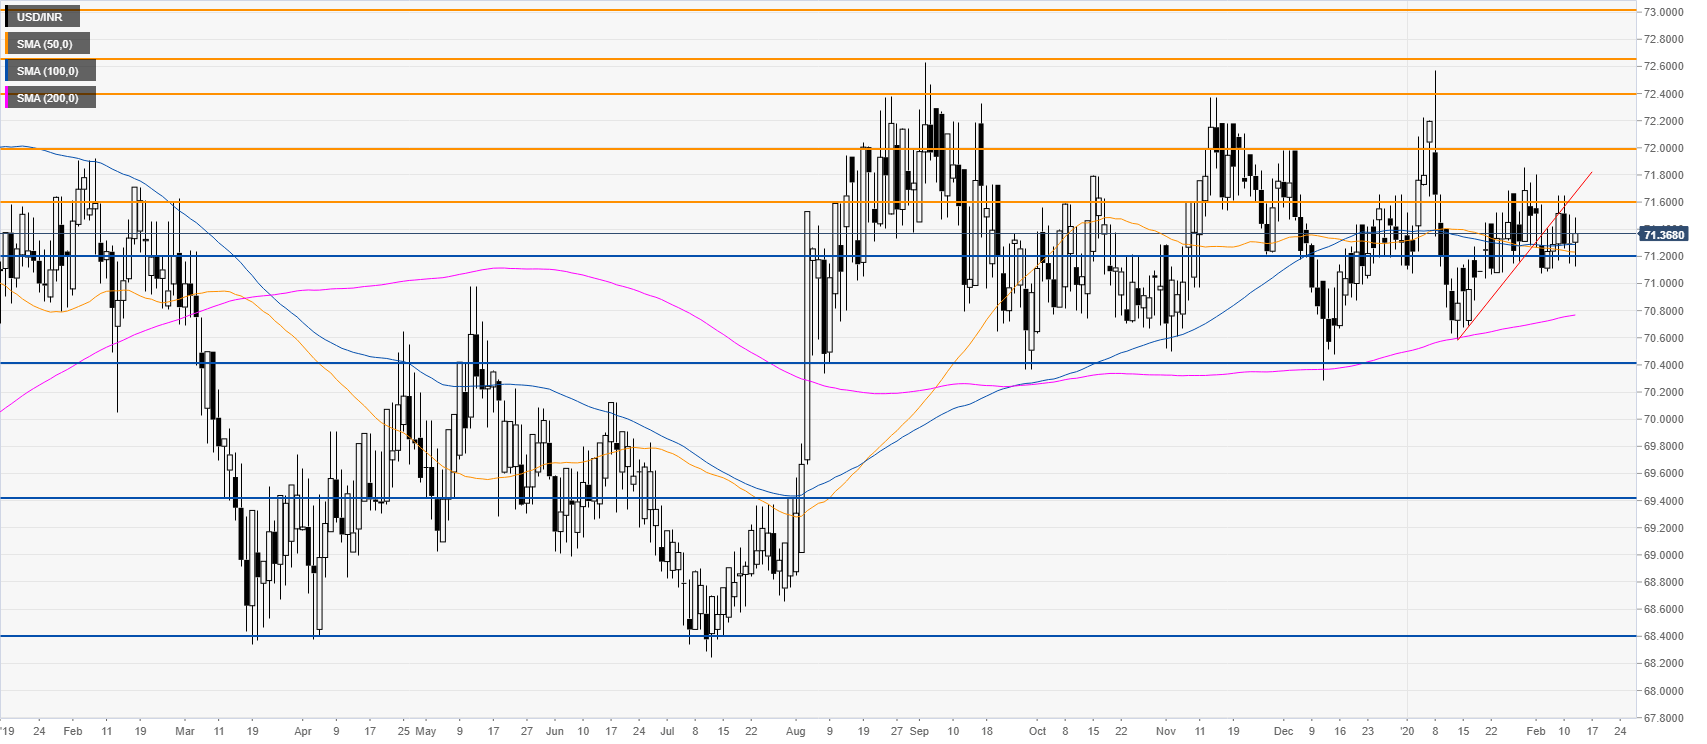
- USD/INR bear flag is keeping a mild bearish pressure on the spot.
- The level to beat for bears is the 71.20 support.
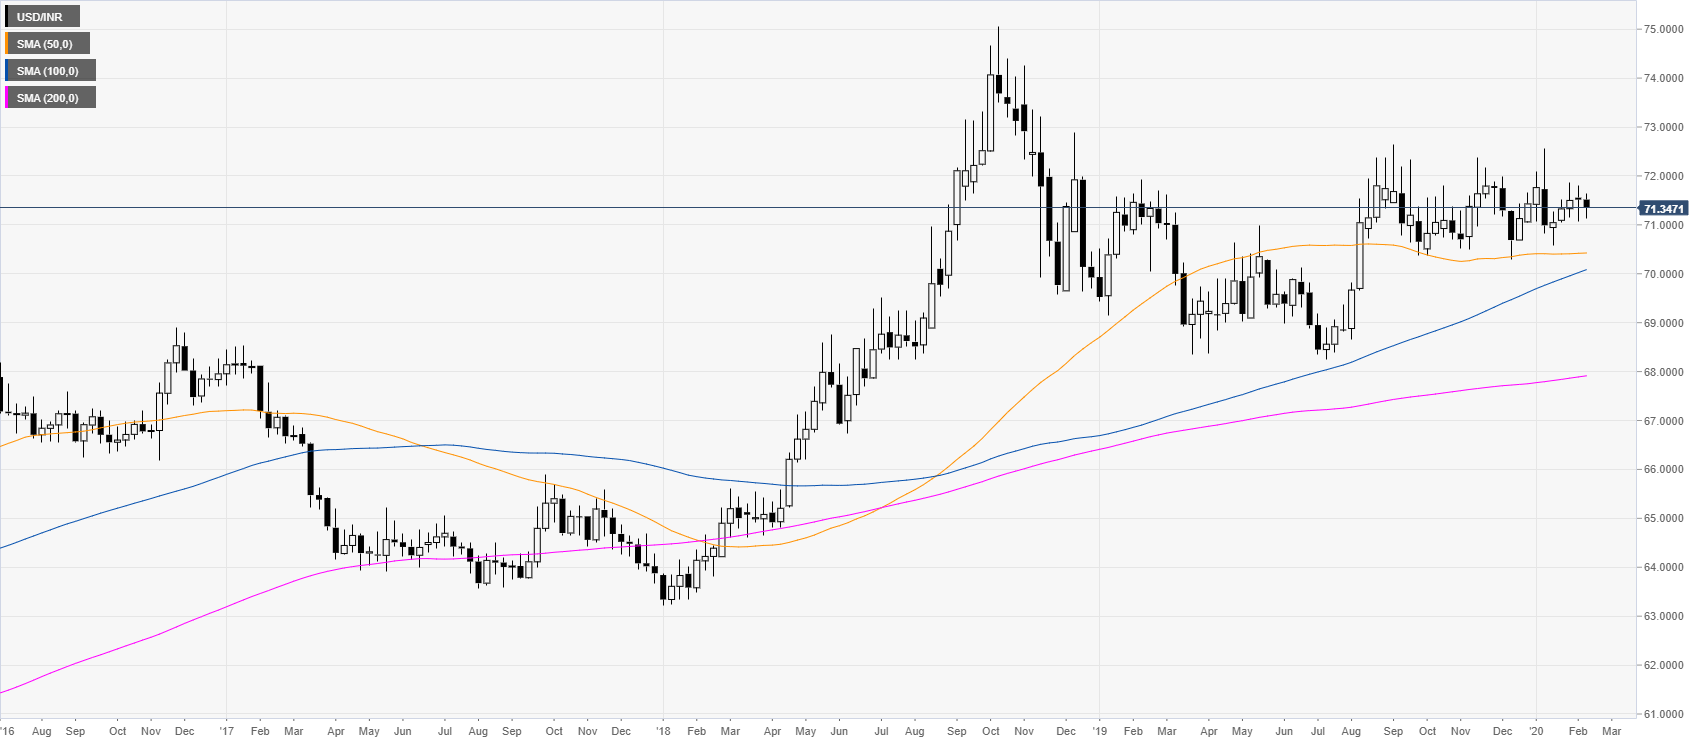
USD/INR weekly chart
Following the 2018 bull-run, USD/INR has been consolidating in a rectangle pattern. The spot is trading above the main weekly simple moving averages (SMAs), suggesting a bullish bias in the long term.
USD/INR daily chart
The spot broke below a bear flag formation challenging the 71.20 support level and then retesting the 71.60 resistance. USD/INR remains weak below the 72.00 figure and could drop towards the 70.40 price level. On the flip side, a daily close above the 72.00 figure could invalidate the bearish scenario and lead to further gains towards the 72.40 level.
Additional key levels
