- GBP/USD is bouncing from the 2020 lows as the spot formed a descending wedge.
- The levels to beat for buyers is the 1.2995 level.
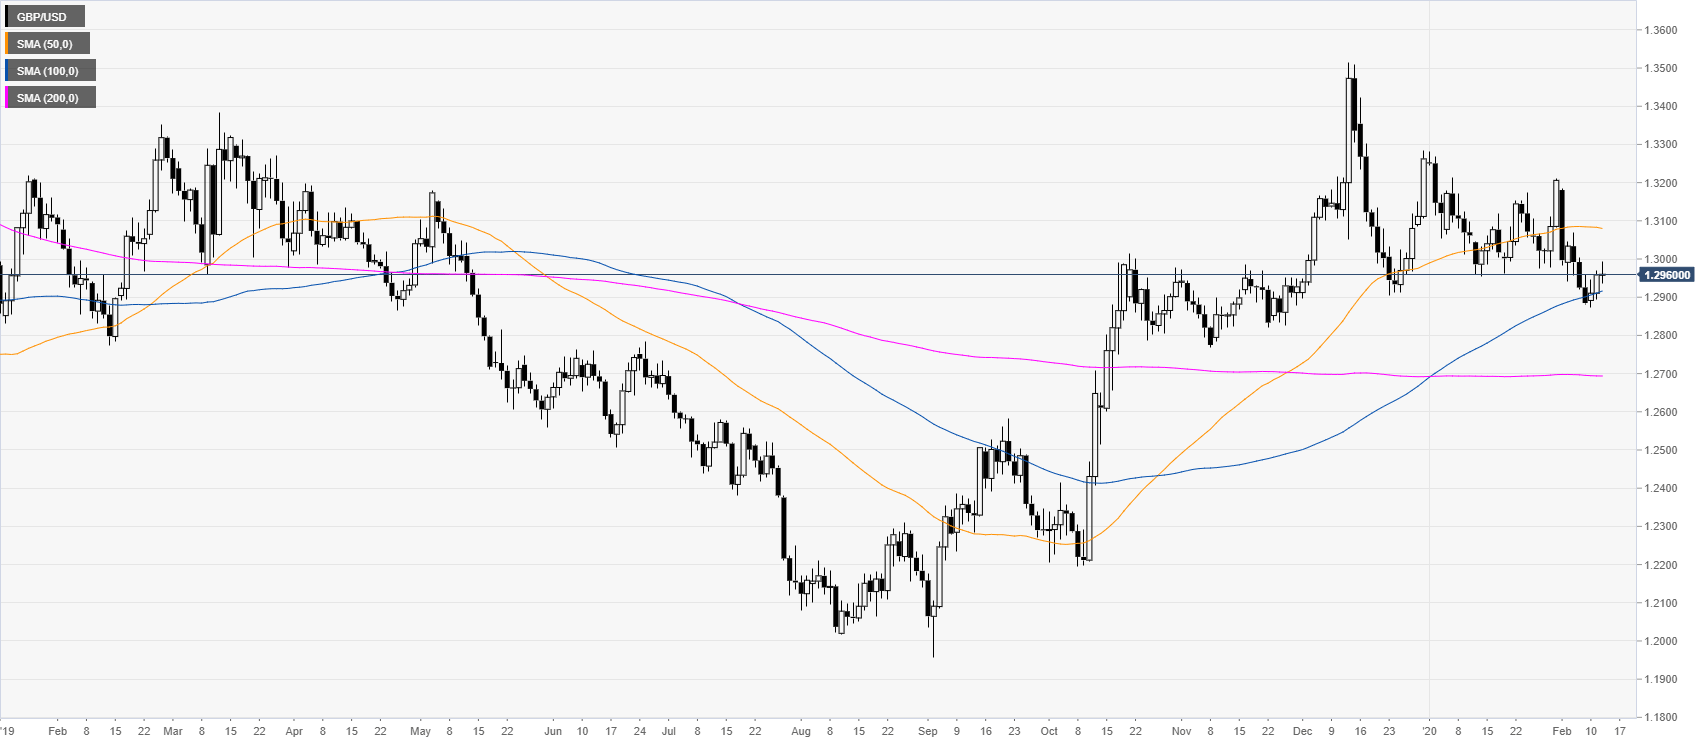
GBP/USD daily chart
Following the October and December bull-runs, GBP/USD is trading in a rectangle consolidation above the 100/200-day simple moving averages (SMAs).
GBP/USD four-hour chart
The pound is pulling back up after the spot formed a descending wedge pattern. Buyers are trying to break the 1.2995 resistance to push the spot towards the 1.3035 and 1.3089 levels. Support is seen near the 1.2954 and 1.2914 price levels, according to the Technical Confluences Indicator.
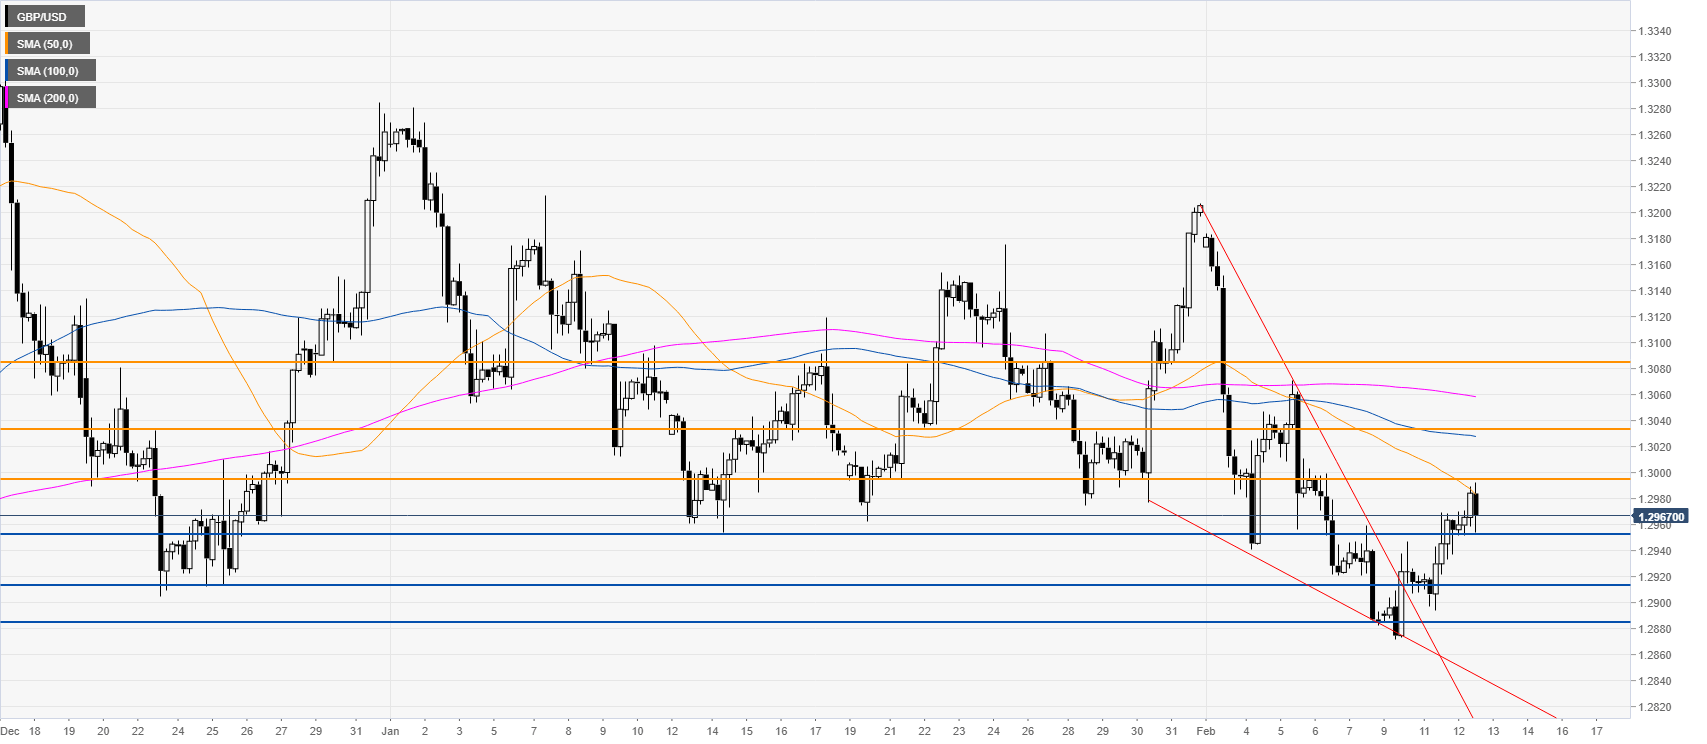
Resistance: 1.2995, 1.3035, 1.3089
Support: 1.2954, 1.2914, 1.2887
Additional key levels
