- AUD/JPY trades near five-day high after breaking a four-week-old falling trend line the previous day.
- The key upside barriers question further advances but the trend reversal is less likely considering bullish MACD, distance from confirming the bearish formation.
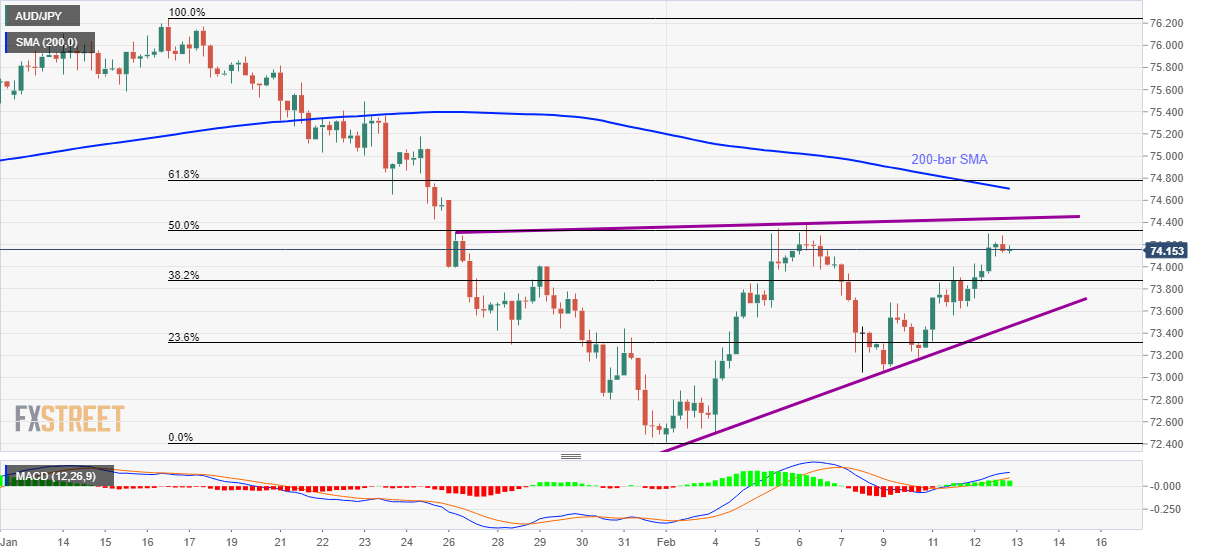
AUD/JPY steps back to 74.13 during the early Asian session on Thursday. The pair recently crossed the monthly resistance line (now support) but fails to extend the run-up amid nearness to the key upside barriers.
Among them, an upward sloping trend line since January 27, near 74.45, becomes the immediate crucial resistance as a break of which will defy the bearish chart pattern.
Following that, 200-bar SMA and 61.8% Fibonacci retracement of the pair’s declines between January 16 and February 02, respectively around 74.70 and 74.80, will be closely watched.
On the downside, a 38.2% Fibonacci retracement level of 73.87 can offer the nearby rest during the fresh pullback. However, sellers will be more interested in watching a sustained break of 73.45 level that comprises the rising wedge’s support, which in turn could trigger a fresh southward trajectory towards 71.50.
It should, however, be noted that the MACD histogram is flashing bullish signals and hence buyers shouldn’t be losing their hope.
AUD/JPY four-hour chart
Trend: Pullback expected
