- EUR/USD has breached key support to hit the lowest level since May 2017.
- The bias remains bearish despite the oversold reading on the RSI.
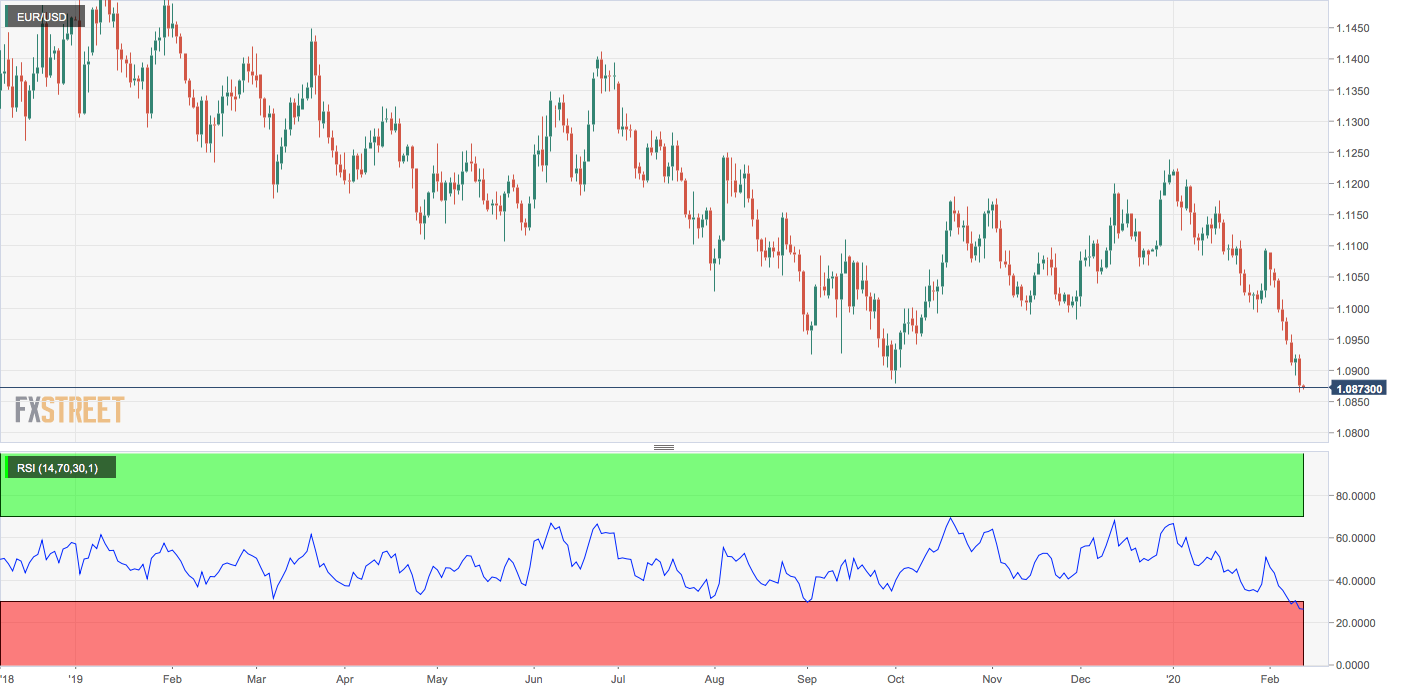
EUR/USD closed at 1.0872 on Wednesday, flipping the support at 1.0879 (Oct. 1 low) into resistance and also hit a low of 1.0865 – a level last seen in May 2017.
The spot is currently trading at 1.0872 – down over 200 pips from the high of 1.1094 observed on Feb. 3.
The 14-day relative strength index (RSI) is currently hovering at 26.83, the lowest level since May 2018. A below-5o reading indicates oversold conditions.
The single currency, therefore, is at its most oversold in 21 months. An oversold reading on the RSI does not imply bullish reversal, but merely indicates exuberant selling pressure.
Also, some markets enter a strong trend after prolonged period of low-volatility trading. In such cases, the RSI can stay oversold or overbought for a long time.
All in all, the bias remained bearish despite RSI’s oversold signal. As per the weekly chart, immediate support is located at 1.0851 (October 2016 low). A sustained move below that level would expose the April 2017 low of 1.0569.
The oversold reading on the RSI would gain credence if the spot prints gains on thursday. That said, a close above 1.1094 is needed to confirm a bullish reversal.
Daily chart
Trend: Bearish
Technical levels
