- WTI bulls catch a break after a four-day-old winning streak.
- A confluence of 100 and 200-day SMAs will challenge the buyers.
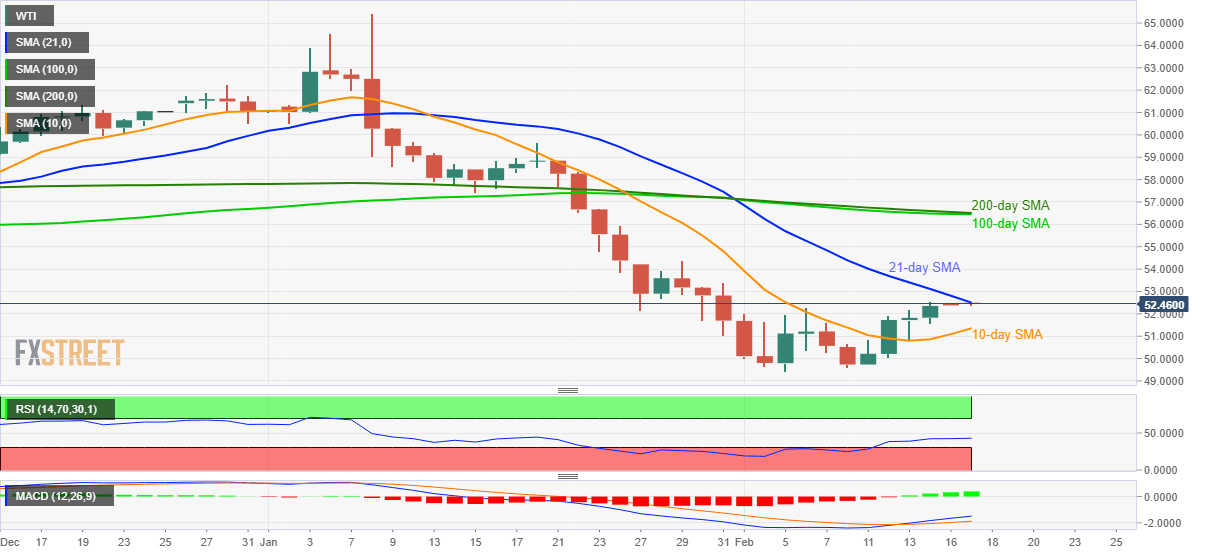
- 10-day SMA offers immediate support.
WTI slips from the monthly top to $52.40 during Monday’s Asian session. In doing so, the pair confronts short-term resistance while staying above the 10-day SMA. Also favoring the buyers are technical indicators like MACD and RSI.
With this, buyers will look for entry beyond a 21-day SMA level of $52.50 while targeting January 29 high near $54.40.
It should, however, be noted that a confluence of 100-day and 200-day SMAs near $56.45/50 will be the key upside barrier to watch during the black gold’s rise past-$54.40.
Meanwhile, a 10-day SMA level near $51.35 could restrict the energy benchmark’s short-term declines.
In the case where oil prices keep trading southwards below $51.35, $50.00 and the monthly bottom surrounding $49.40 should be watched carefully.
WTI daily chart
Trend: Further recovery expected
