- USD/CNH stays mildly positive above the five-week-old rising trend line, 100-day SMA.
- December 2019 high will be next to lure the bulls.
- The Horizontal support around 6.9565/75 can question the bears below the key SMA.
USD/CNH register gains to 7.0357 during early Wednesday. In doing so, the quote maintains its run-up beyond the short-term rising trend line since January 20 as well as 100-day SMA. Also favoring the buyers are bullish MACD signals.
That said, 61.8% Fibonacci retracement of the pair’s declines from October 2019 to January 2020, at 7.0622, is likely next on the buyers’ radar.
If USD/CNH prices remain strong above 7.0622, December 2019 top near 7.0870 will be important as it holds the key to the pair’s further rise towards 7.1000 mark.
Meanwhile, the aforementioned support line, around 7.0215 now, as well as 100-day SMA near 7.0045 can keep questioning the bears ahead of highlighting multiple supports since early-January 2020 around 3.9575/65.
USD/CNH daily chart
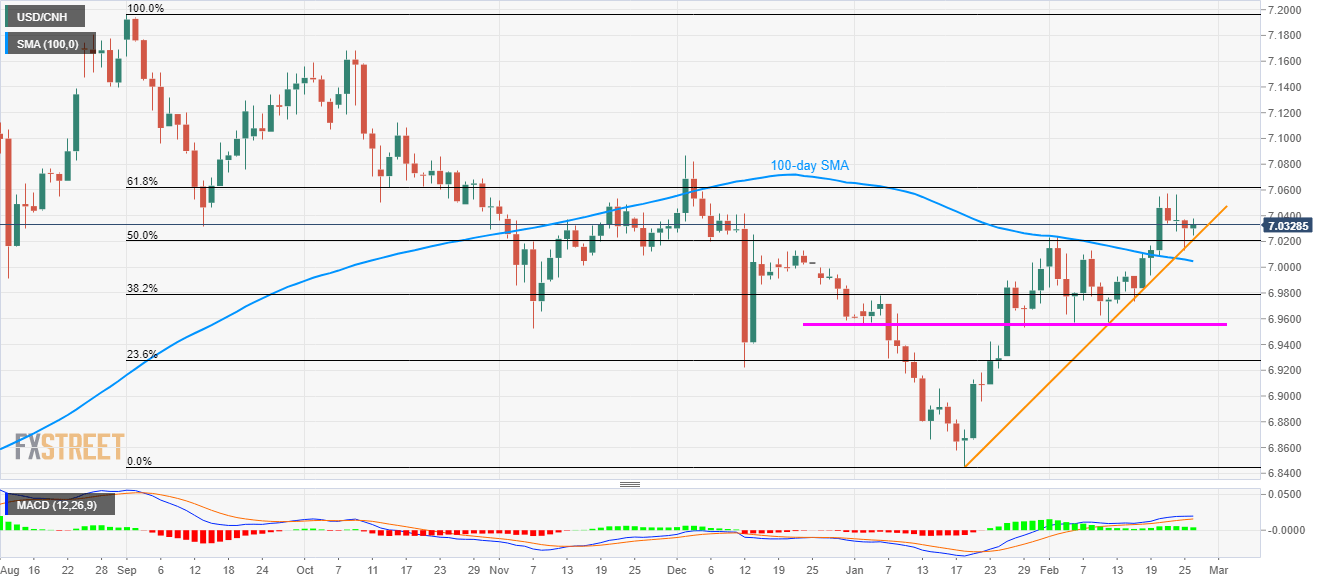
Trend: Bullish
