- Ethereum has bounced back on Thursday after a few tough sessions.
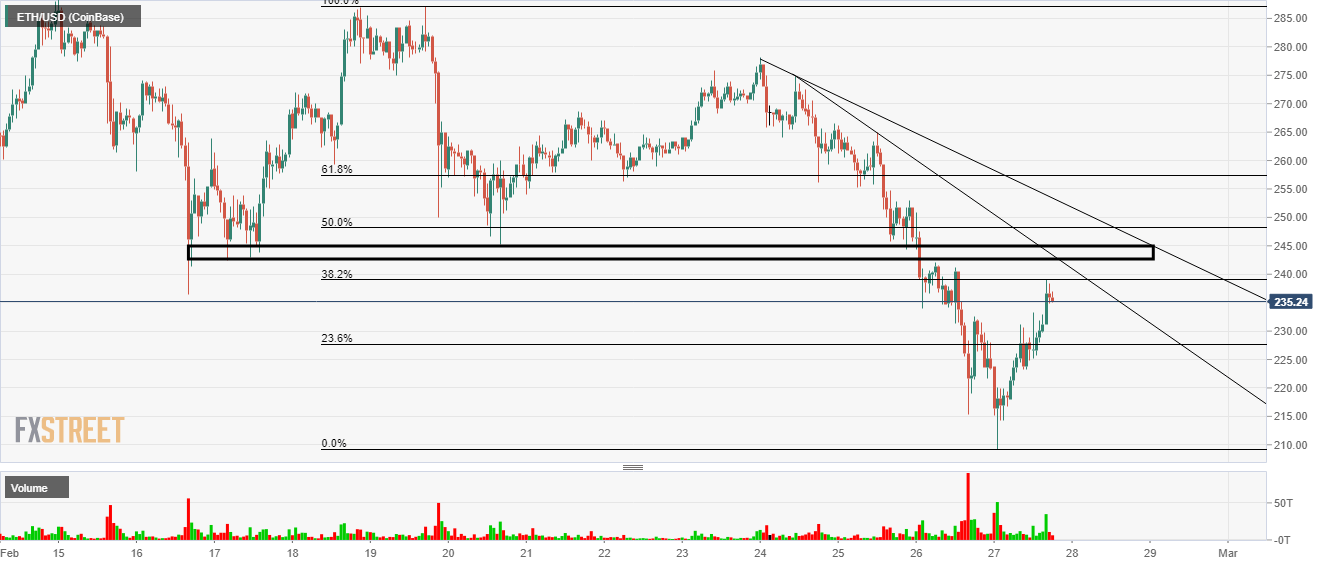
- The price has just met some intraday resistance at the 38.2% Fibonacci level.
ETH/USD 1-Hour Chart
Ethereum fell around 27% from the high seen on February 18th.
Now there have been some signs of a small recovery but more data is needed.
Today the price has moved 4.5% higher but stopped short on the 38.2% Fibonacci level (240.00).
For the downtrend to continue a close below 215.00 would be needed.
On the upside, the next resistance is at 250.00 and on the chart below you can see it had been used many times.
Additional Levels
 Share