- USD/INR bull trend stays intact as the spot is off three-decades highs.
- A deeper retracement down cannot be ruled out.
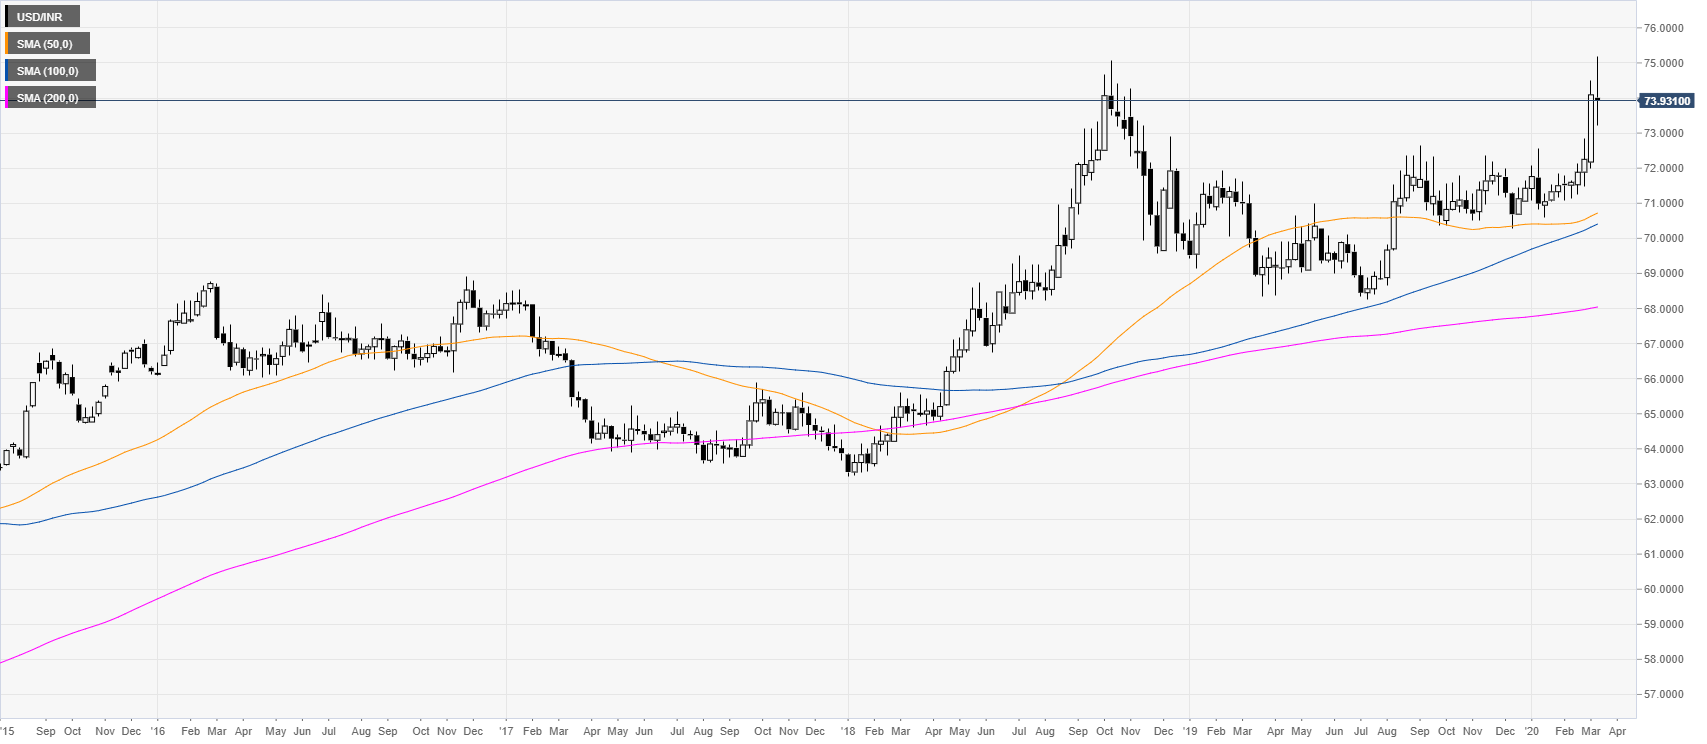
USD/INR weekly chart
USD/INR is trading above its main weekly simple moving averages (SMAs) as it printed a fresh three-decade high at the 75.19 level.
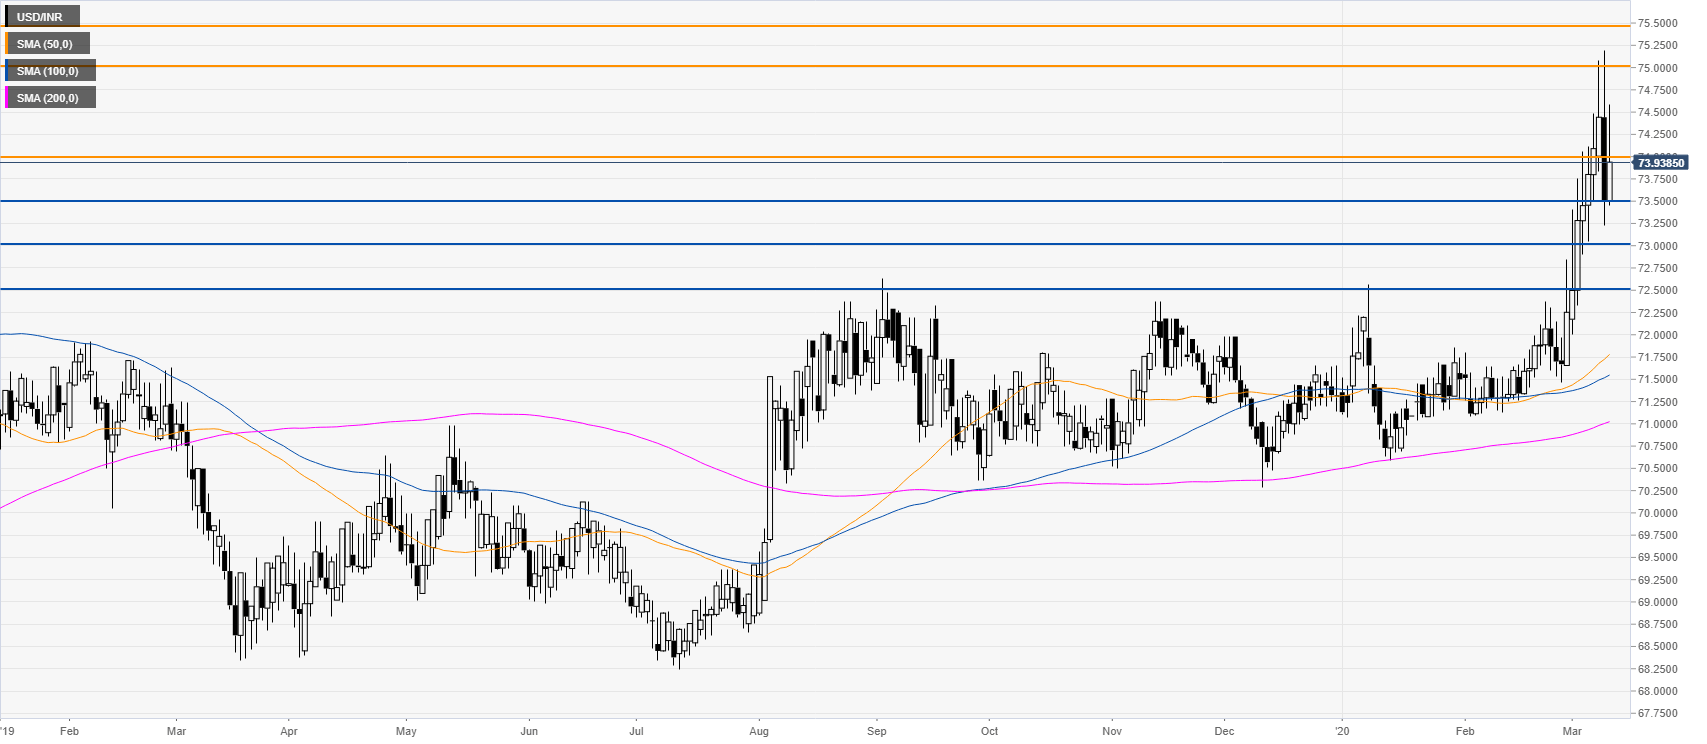
USD/INR daily chart
The spot is retracing down from the 75.00 figure while challenging the 74.00 level. A daily close below 73.50 could lead to a deeper pullback down towards 73.00 and 72.50 levels. Bulls would need to recapture the 75.00 resistance in order to travel into uncharted territories.
Additional key levels
