- USD/JPY bullish pressure remains unabated at the start of the week.
- The level to beat for bulls is the 111.53 resistance.
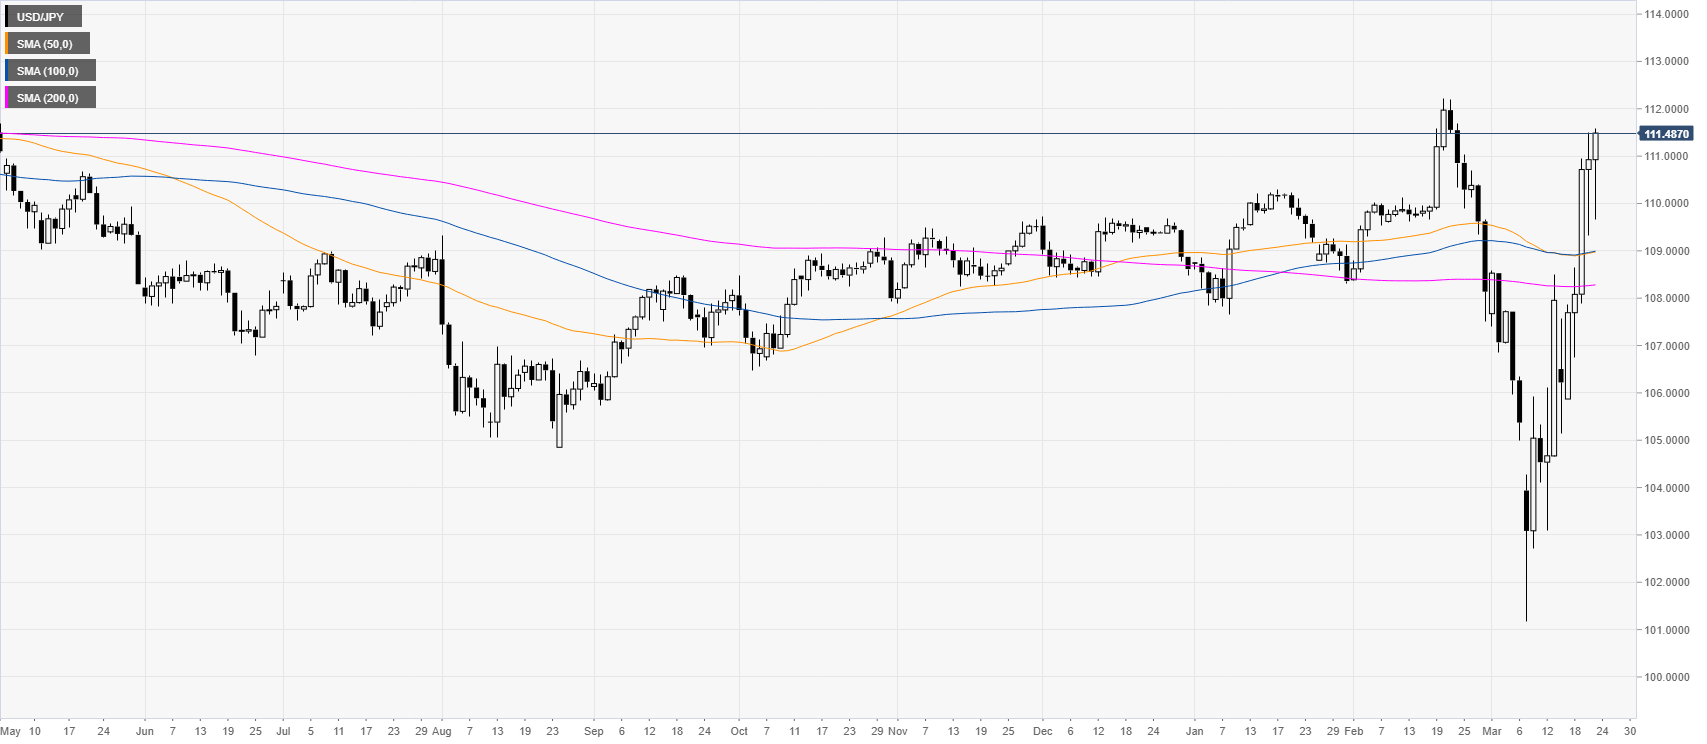
USD/JPY daily chart
USD/JPY is bouncing up sharply from the 2020 lows as bulls are eying the 2020 highs. The Fed launched an unlimited Quantitative Easing (QE) however the demand for US dollars vs. yen remains for now unabated at the start of the week.
USD/JPY four-hour chart
USD/JPY bull trend is intact as bulls are challenging the 111.53 resistance. A break beyond the above-mentioned level should lead to further gains towards the 112.46 and 114.00 price levels. Support is expected to hold near 111.00, 110.48 and 110.20 levels.
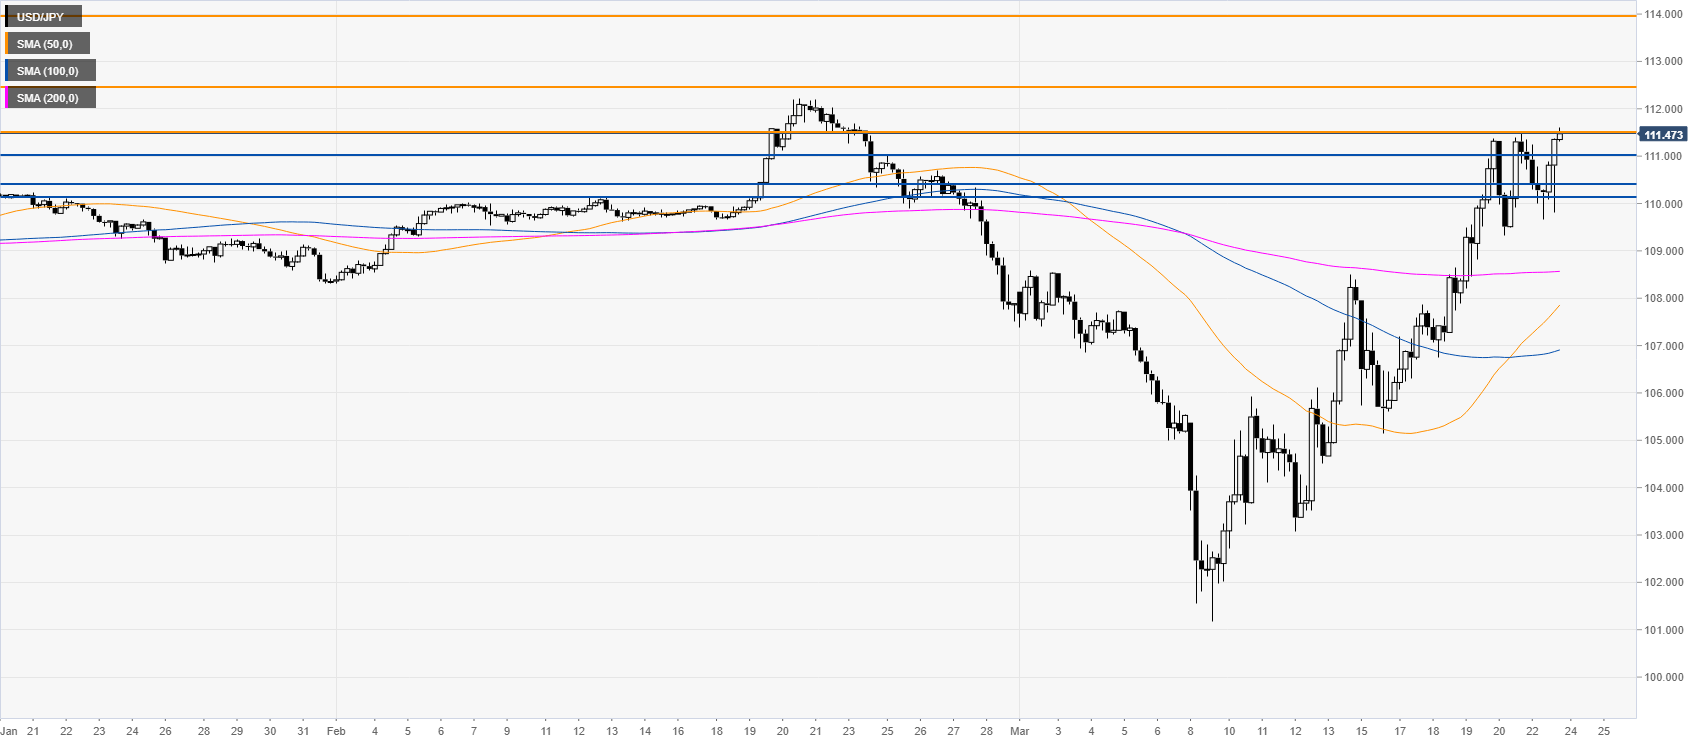
Resistance: 111.53, 112.46, 114.00
Support: 111.00, 110.48, 110.20
Additional key levels
