- GBP/USD remains mildly positive after breaking a one-week-old falling trend line.
- 1.1800 limits the immediate upside ahead of 200-HMA.
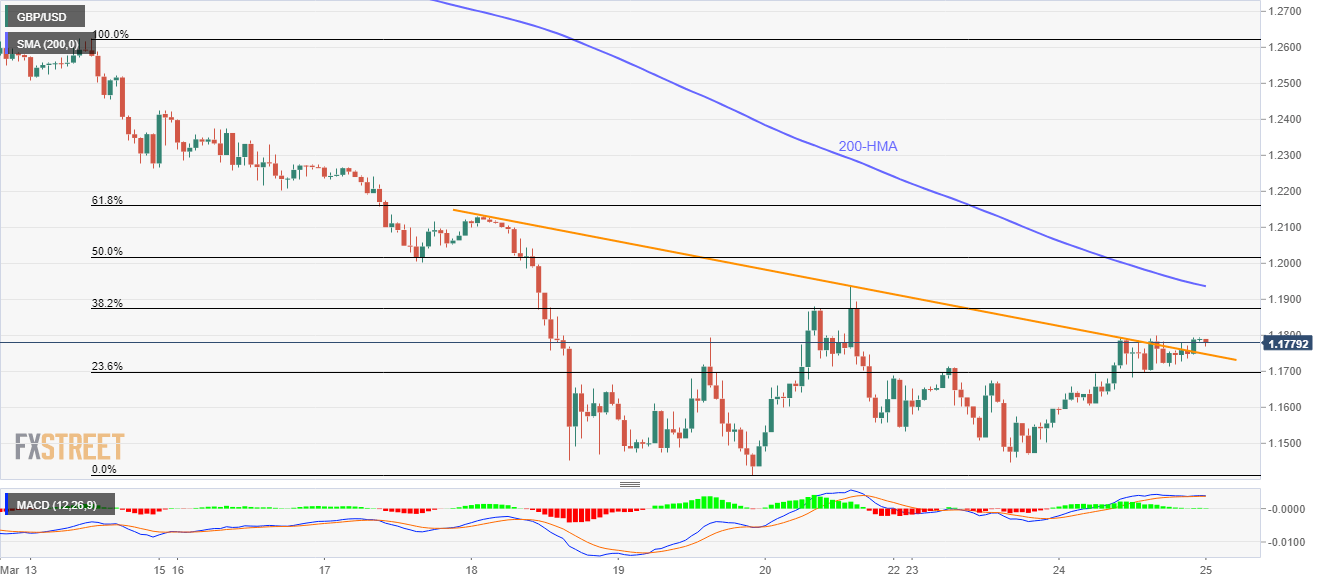
- Sellers look for entry below 23.6% Fibonacci retracement.
Having breached a weekly falling trend line, GBP/USD takes rounds to 1.1780 amid the Asian session on Wednesday.
Even so, the pair fails to provide a clear break of 1.1800, which in turn could escalate the recovery moves towards a 200-HMA level of 1.1940.
During the pair’s sustained rise past-1.1940, 50% and 61.8% Fibonacci retracements of March 13-19 fall, respectively near 1.2015 and 1.2160 could please the bulls.
Meanwhile, sellers will seek entry below 23.6% Fibonacci retracement figures of 1.1700.
In doing so, 1.1550 and 1.1450/45 could be on their radars ahead of the recently flashed multi-year low near 1.1410.
GBP/USD hourly chart
Trend: Further recovery expected
