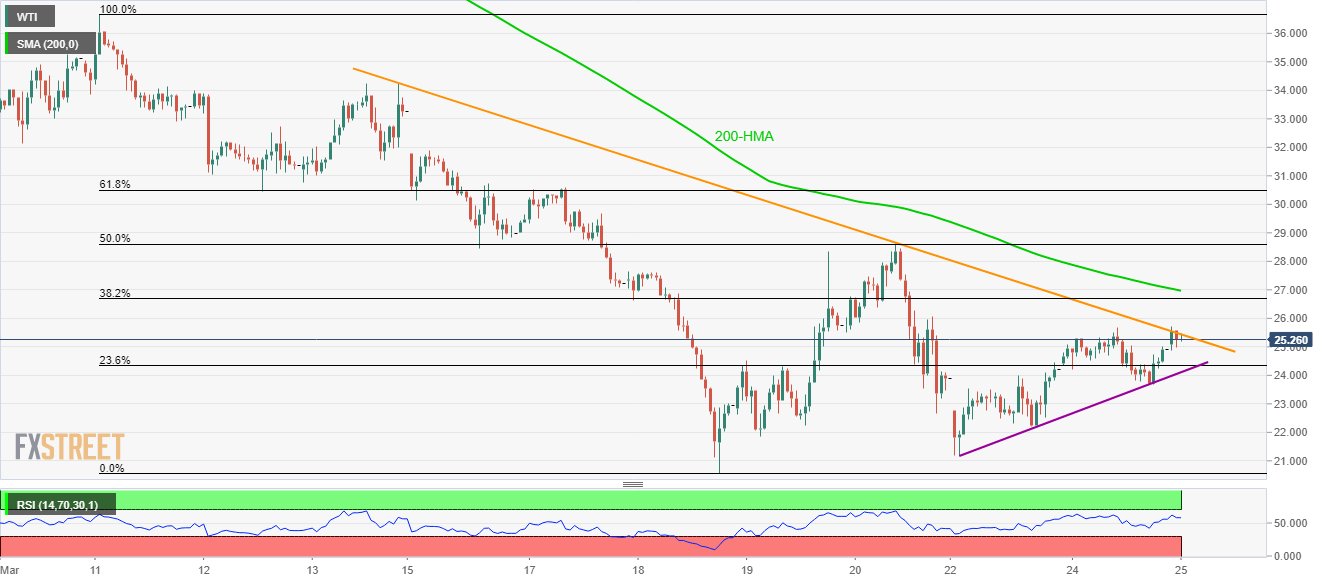
- WTI probes an eight-day-old falling trend line during the recent recovery.
- The weekly rising support line limits the immediate declines.
- Buyers remain cautious ahead of breaking 50% Fibonacci retracement.
WTI holds onto recovery gains while taking the bids to $25.28, up 1.5%, by the press time of Wednesday’s Asian session.
In doing so, the black gold confronts a short-term descending resistance line, currently at $25.45.
Given normal RSI conditions and a higher low formation on the daily chart, the energy benchmark is expected to register additional upside, towards 200-HMA level of $27.00, after breaking the trend line barrier.
However, buyers will remain cautious unless manage to break 50% Fibonacci retracement of March 11-18 declines near $28.60.
On the downside, 23.6% Fibonacci retracement level of $24.30 and a weekly rising trend line, at $24.10 now, could limit the quote’s immediate declines.
Should oil prices remain weak below $24.10, also break $24.00, bears targeting a sub-$20.00 mark can re-enter.
WTI hourly chart
Trend: Recovery expected
