- AUD/JPY confirms the downside break of a two-week-old ascending triangle.
- 38.2% Fibonacci retracement can offer immediate support.
- 61.8% of Fibonacci retracement will validate upside past the triangle’s resistance line.
Following its U-turn from the two-week-old horizontal resistance, AUD/JPY confirms short-term rising triangle formation while declining below the support line to 65.70 during the early Asian session on Thursday.
The pair currently rests near 38.2% Fibonacci retracement of its one-month fall between February 19 and March 19, 2020.
While the confirmation of a bearish signal, coupled with the weakness in the MACD histogram, the pair is expected to stretch the recent declines.
In doing so, 63.90 and 23.6% Fibonacci retracement level of 63.30 can please short-term sellers ahead of diverting them towards 60.00 round-figure.
On the upside, 61.8% Fibonacci retracement, at 68.90, will be the validation point for the pair’s rise above the triangle’s resistance line around 67.70.
It should also be noted that the support-turned-resistance trend line, near 66.40, followed by a 50% Fibonacci retracement level of 67.20, can challenge the pair’s pullback moves.
AUD/JPY four-hour chart
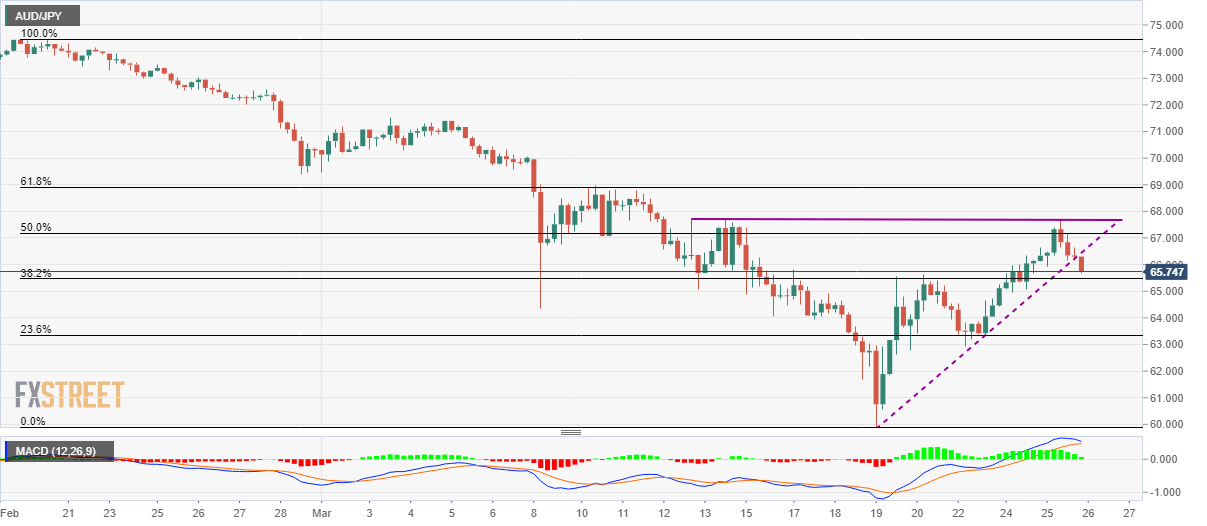
Trend: Bearish
