- US dollar index (DXY) broke below the 100.00 figure and the 50 SMA on the four-hour chart.
- The correction down can extend further below the 99.00 level.
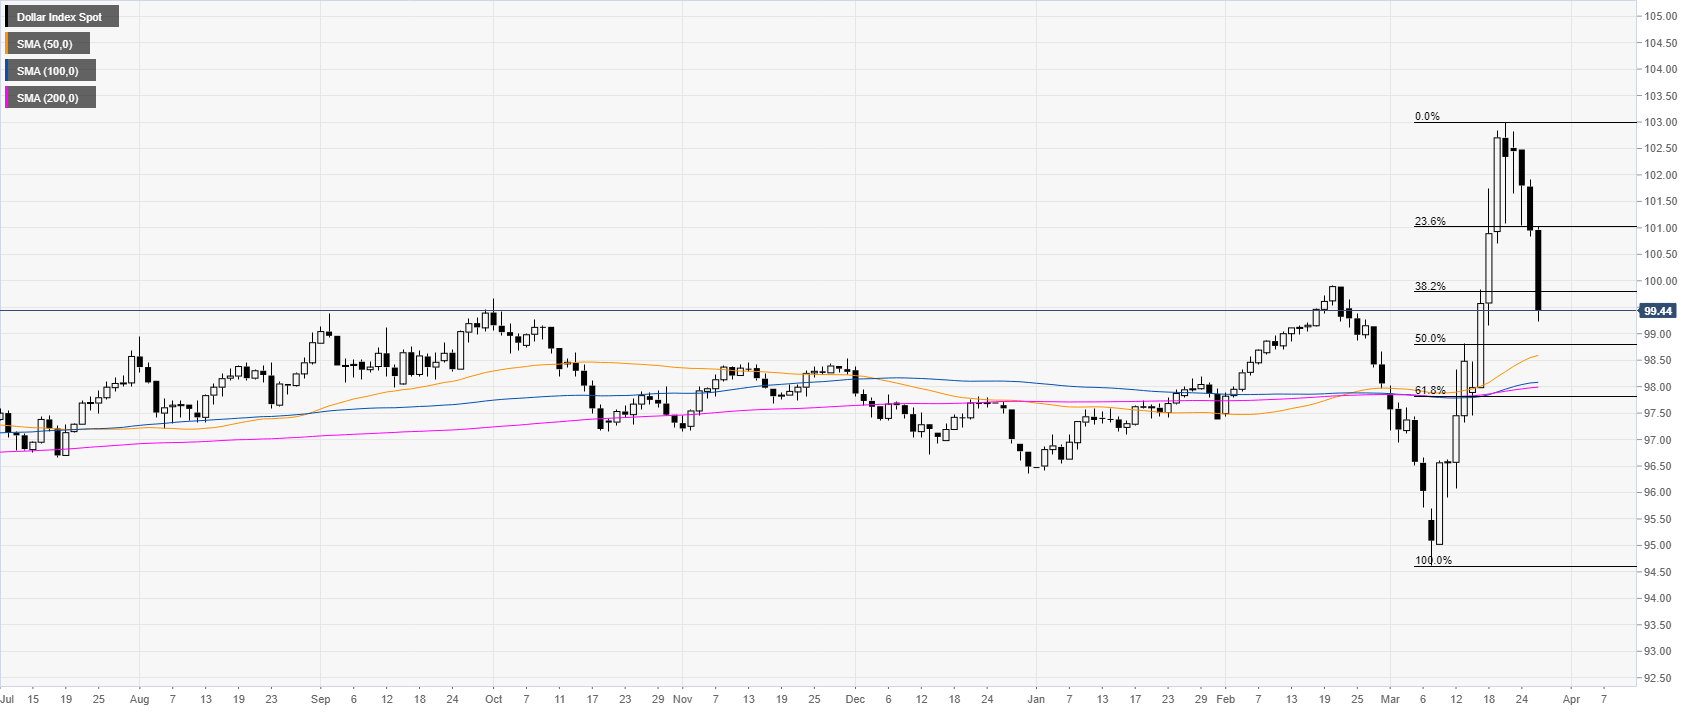
DXY daily chart
DXY is retracing down for the fifth consecutive day after an above-average spike to the upside. The pullback down exceeded the 38.2% Fibonacci level from the last bullish run.
DXY four-hour chart
The greenback broke below the 100.00 big figure and the 50 SMA on the four-hour chart as the retracement down is intensifying and could extend to the 99.00, 98.50 and 97.50 price levels on the way down. Bullish attempts can find resistance near the 100.00, 100.50 and 101.50 price levels;
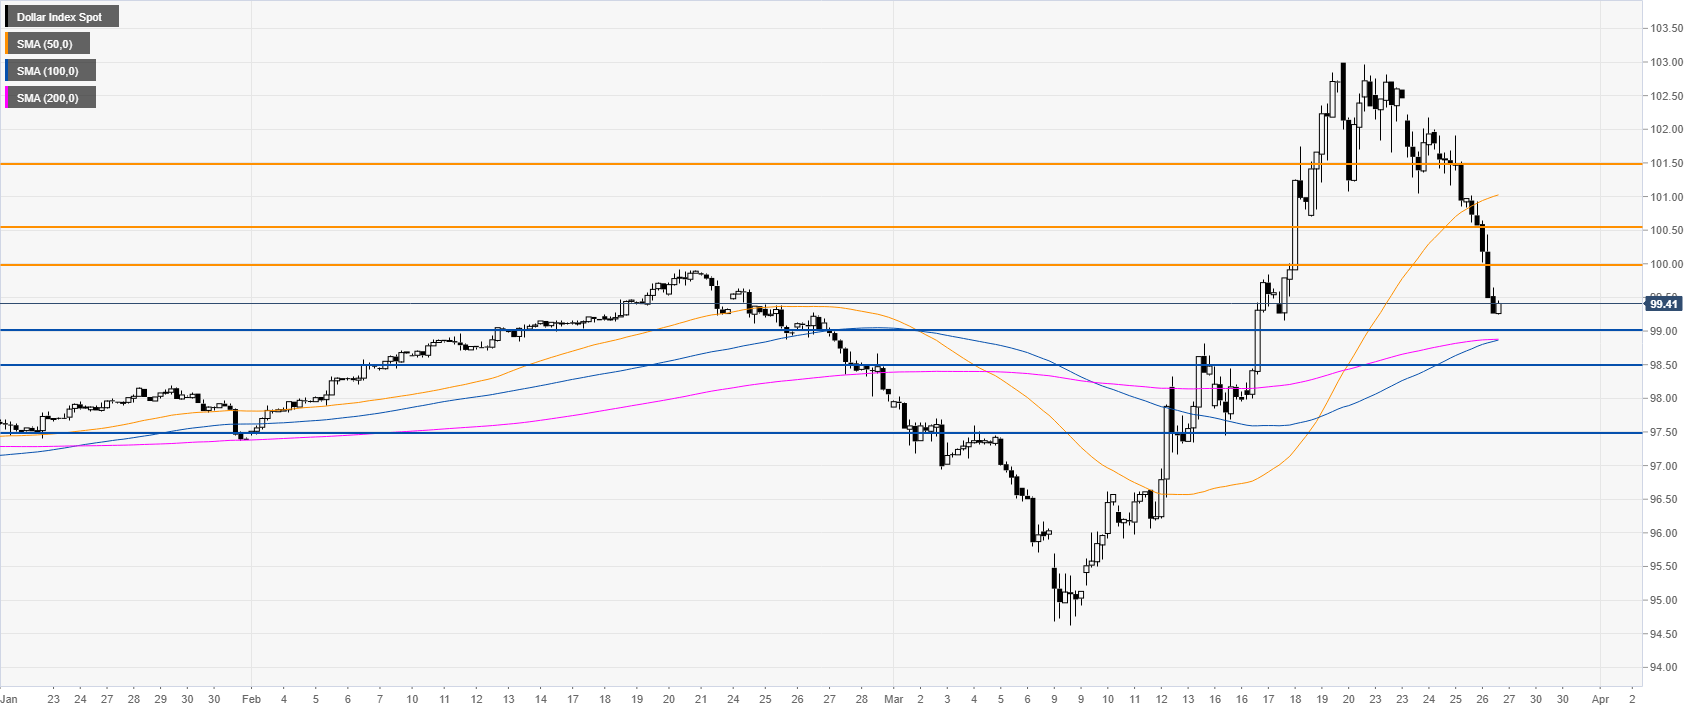
Additional key levels
