- NZD/USD probes the four-day winning streak.
- Weekly rising support line, 38.2% Fibonacci adds to the downside barriers.
- 61.8% Fibonacci retracement holds the key to a mid-month top.
- Nearly overbought RSI favors pullback.
Having surged to the eight-day top the previous day, NZD/USD steps back from 100-bar EMA to 0.5960 during the Asian session on Friday. Even so, the pair remains above 50% Fibonacci retracement of its March 09-19 declines.
In addition to the 100-bar EMA, nearly overbought RSI conditions also increase the odds to the pair’s pullback below 50% Fibonacci retracement of 0.5960 to the one-week-old rising trend line, at 0.5835 now.
If at all bears fail to respect the support line, the return of 0.5600 on the charts can’t be ruled out.
Meanwhile, buyers remain hopeful to confront 61.8% Fibonacci retracement level of 0.6075 once they overcome the 100-bar EMA level of 0.5975.
Following that, the mid-month highs surrounding 0.6150 will be on the bull’s radars.
NZD/USD four-hour chart
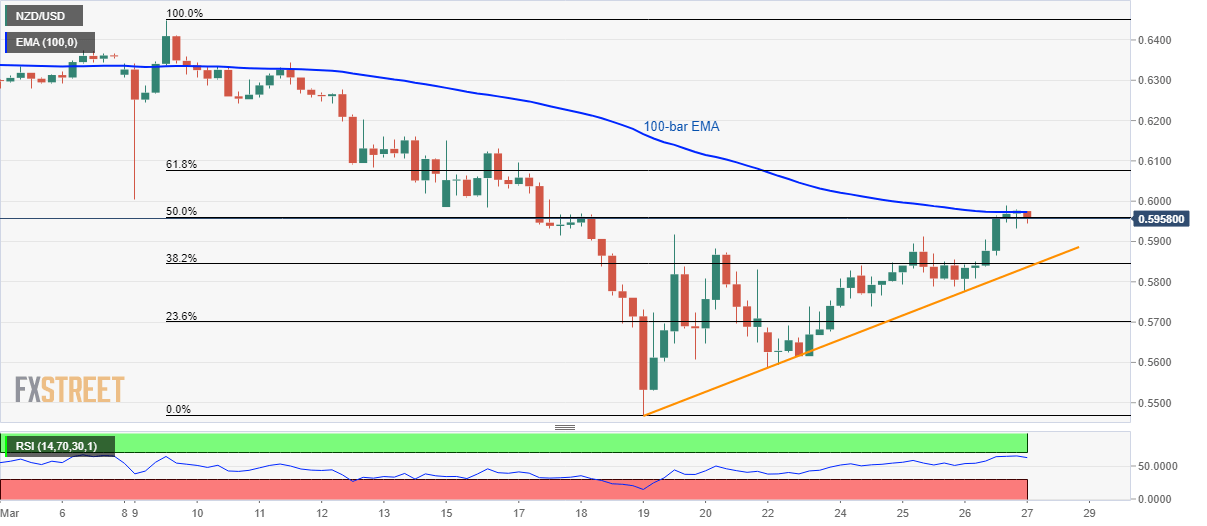
Trend: Pullback expected
