US Dollar Index (DXY) registers six-day losing streak, below 21-day EMA for the first time in two weeks.
Buyers will watch for an upside break of 101.00 to re-enter.
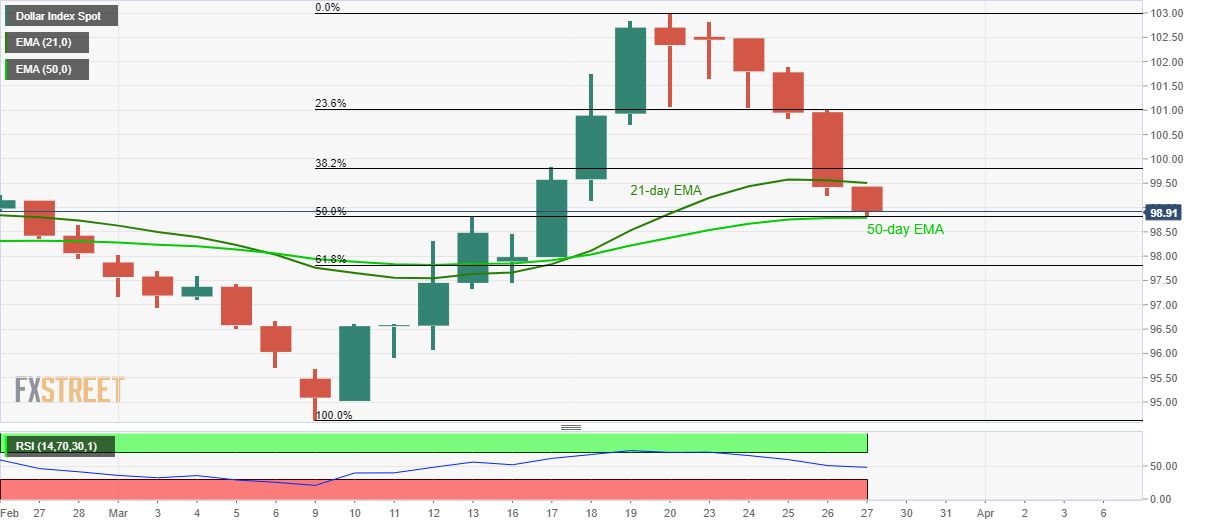
US Dollar Index remains on the back foot while declining to the lowest since March 17, 2020, down 0.50% to 98.90, ahead of the European session open on Friday.
In doing so, the greenback gauge slips below 21-day EMA for the first time in two weeks while nearing the short-term key support confluence comprising 50-day EMA and 50% Fibonacci retracement of March 09-20 upside, near 98.80.
While a sustained break of the short-term EMA disappoints the buyers, confluence of the key Fibonacci and EMA questions the bears.
As a result, the sellers will wait for a clear break of 98.80 for fresh short positions.
On the contrary, the buyers can target 23.6% Fibonacci retracement level of 101.00 if manage to successfully bounce back beyond a 21-day EMA level of 99.50.
DXY daily chart
Trend: Pullback expected
