- USD/MXN searches for a clear direction below 10-day SMA, 23.6% Fibonacci retracement.
- 21-day SMA limits immediate downside, overbought RSI conditions signal weakness.
Despite marking losses the previous day, USD/MXN registers 0.2% gains to 23.75 during the Asian session on Wednesday. The pair took a U-turn from 10-day SMA and 23.6% Fibonacci retracement of its March month upside the previous day.
Considering the nearly overbought conditions of RSI, the pair is less likely to extend the latest recovery moves and can drop to 38.2% Fibonacci retracement level around 23.00 amid further downside.
Though, 21-day SMA near 22.67 could question the pair’s declines past-23.00.
If at all USD/MXN prices cross 23.95 – 24.00 confluence, 24.60 and 25.00 round-figure could offer intermediate halts to the last week’s top, also the record high, near 25.45.
USD/MXN forecast chart
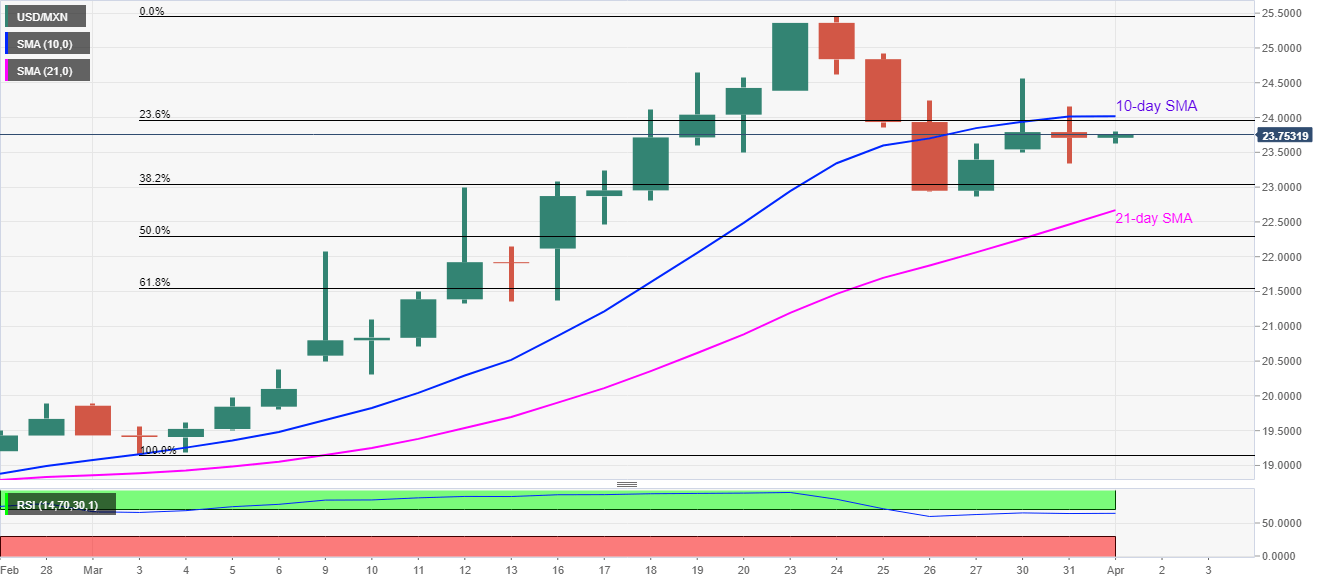
Trend: Pullback expected
