Gold is eyeing the Easter week with a better position, after having closed the previous trading week at $1,618. The coronavirus crisis pushed XAU/USD higher, albeit it suffered a downfall afterward. Can it challenge the multi-year highs? It must first hit lower targets, but with robust support, the path seems clearer.
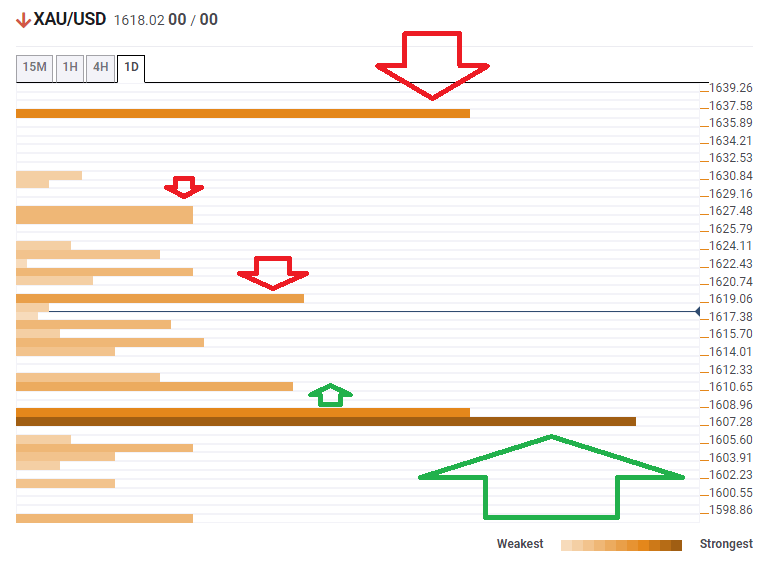
The Technical Confluences Indicator is showing that gold has its first soft hurdle at $1,619, which is the convergence of the Simple Moving Average 5-4h and the Fibonacci 38.2% one-day.
Another minor cap is at $1,627, where the Pivot Point one-day Resistance 1 and the previous daily high meet.
The upside target is $1,636, which is the convergence of the previous weekly high and the PP one-day R2.
Some support awaits at $1,610, where the SMA 200-1h, the SMA 50-4h, and the Fibonacci 61.8% one-week.
The strongest support line which helps paint the bullish picture is at $1,607, where the 10-day SMA, the Bollinger Band 1h-Lower, the previous daily low, and the Fibonacci 61.8% one-month all converge.
Here is how it looks on the tool:
Confluence Detector
The Confluence Detector finds exciting opportunities using Technical Confluences. The TC is a tool to locate and point out those price levels where there is a congestion of indicators, moving averages, Fibonacci levels, Pivot Points, etc. Knowing where these congestion points are located is very useful for the trader, and can be used as a basis for different strategies.
This tool assigns a certain amount of “weight” to each indicator, and this “weight” can influence adjacents price levels. These weightings mean that one price level without any indicator or moving average but under the influence of two “strongly weighted” levels accumulate more resistance than their neighbors. In these cases, the tool signals resistance in apparently empty areas.
Learn more about Technical Confluence
